|
OCEAN SEQUESTRATION OF CARBON DIOXIDE
Ocean sequestration technique of CO2 may not be able to replace the cut of CO2 emission itself, but can be one of quick-effect measures against the climate warming, elevation of sea level, and other influences of the global climate changes due to greenhouse gas accumulation in the atmosphere. Environmental effects of CO2 ocean sequestration on surrounding sea areas must be properly assessed. One of the proposed methods consists in releasing CO2 from onshore plants through pipeline at pre-determined depth in the ocean. In another, CO2 may be continuously released into the middle depth from a ship cruising at a slow speed (Ozaki, 2001). In alternative methods, CO2 may be deposited on the deepest sea bottom where no current and turbulence are considered to exist. In order to examine the feasibility of CO2 sequestration technique, we followed the behavior of CO2 released into the Pacific Ocean using the flow field discussed in the chapters above. We analyzed a case in which CO2 generated by electric power plants is released through a pipeline at a fixed point in the ocean.
Amount of CO2 to be sequestrated
Total CO2 emission of Japan in 1999 was billion tons (as CO2), according to a report published by Environment Ministry in 2001. This amount exceeds by about 0.046 Gt (as C) the targeted cut of emission stated in COP3 (6% cut from the reference year of 1990). We examined by numerical simulation the behavior of this excess CO2 that might be continually introduced in a single cell of the Pacific Ocean for 50 years. Whole calculated sea area was 0 (μmol/kg) at the initial state. The site of introduction was supposed to be under the stratification layer (in this study we assume the 7th layer) at the subarctic region of the Northern Pacific Ocean, where has the potential to absorb CO2.
Calculation of Predicted Behavior of Sequestrated CO2
Behaviors of sequestrated CO2 are calculated by the following equation:
Where C the total carbonate concentration (μmol/kg), t is time (s), KH the horizontal diffusion coefficient 1.0x106cm2/s, Kv the vertical diffusion coefficient (1.0 x 10cm2/s) and β(λ,ψ,t) the annual input concentration of CO2, 1.26 x 10² (μmol/kg/yr). The value of C was calculated from the surplus over the targeted emission cut (0.046 Gt).
Predicted behavior of sequestrated CO2
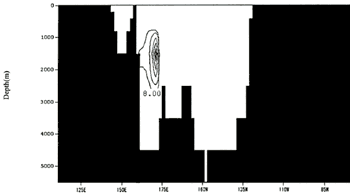
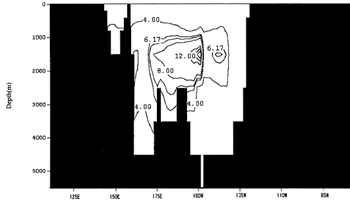
To consider the CO2 sequestration, most important problem is even if the injected CO2 can be saved in the ocean for a long time. From the viewpoint of marine ecology, an abnormally high CO2 concentration in specific sea areas must be avoided. Effects on meiobenthos, small bottom-living creatures less than 1 mm with little mobility, such as nematodes and foraminiferans, have also to be taken into consideration. Table 2 shows that calculation results of the total amount of CO2 reaching for the surface, maximum CO2 concentration at the surface and ratio of CO2 reaching for the surface layer after the 50 years continual discharging in the North Pacific Subarctic region, is well known to the CO2 absorption areas. The different sites of injection cause the variation of the total amount of CO2 reaching for the surface and maximum CO2 concentration at the surface. In case of zonal sites variation, further eastern sequestration can suppress the amount of reaching the CO2 in the sea surface layer. On the other hand, meridional sites changes do not influence the CO2 concentration. These trends are same in the all test case of injection CO2. Figure 2 shows vertical distribution of CO2 concentration at latitude 170°E and longitude 52°N in case of injection at 7th layer and Figure 3 shows vertical distribution of CO2 concentration (μmol/kg) at latitude 160°W and longitude 52°N in case of injection at 7th layer.
Table 2. Evaluation of the CO2 injection at the 7th layer using the CO2
diffusion model in the North Pacific Subarctic region
| Injection Point |
Total amount of CO2
reaching for the surface
(X 10-3G t) |
Maximum CO2
concentration at the surface
(μmol/kg) |
Ratio of CO2
reaching for the surface layer
(%) |
| 50°North, |
160°East |
14.20 |
3.50 |
30.87 |
| 170°East |
10.90 |
3.87 |
23.70 |
| 180° |
9.84 |
3.67 |
21.39 |
| 170°West |
10.40 |
3.79 |
22.61 |
| 160°West |
8.11 |
3.26 |
19.22 |
| 150°West |
7.51 |
3.02 |
17.63 |
| 140°West |
6.68 |
2.66 |
16.33 |
| 52°North, |
160°East |
13.90 |
3.37 |
30.22 |
| 170°East |
11.60 |
3.58 |
25.22 |
| 180° |
11.30 |
3.67 |
24.57 |
| 170°West |
10.90 |
3.68 |
23.70 |
| 160°West |
9.78 |
3.46 |
21.26 |
| 150°West |
8.71 |
3.21 |
18.93 |
| 140°West |
7.21 |
2.65 |
15.67 |
| 54°North, |
160°East |
14.50 |
3.74 |
31.52 |
| 170°East |
12.10 |
3.74 |
26.30 |
| 180° |
11.80 |
3.83 |
25.65 |
| 170°West |
11.40 |
3.59 |
24.78 |
| 160°West |
9.17 |
3.22 |
19.93 |
| 150°West |
9.19 |
3.31 |
19.98 |
| 140°West |
6.82 |
2.50 |
14.83 |
|
| (Enlarge: 9KB) |
 |
Figure 2. Vertical distribution of CO2 concentration
(μmol/kg) at latitude 170°E and longitude 52°N in case of injection at 7th layer
| (Enlarge: 13KB) |
 |
Figure 3. Vertical distribution of CO2 concentration
(μmol/kg) at latitude 160°W and longitude 52°N in case of injection at 7th layer
| (Enlarge: 16KB) |
 |
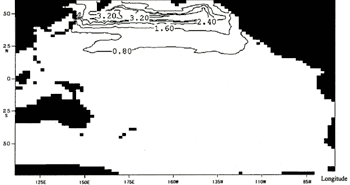
Figure 4. Surface distribution of CO2 concentration
(at 10 m depth) in case of injection at latitude 160°W and longitude 52°N, 7th
layer
Figure 4 shows the surface distribution of CO2 concentration when CO2 was released at 7th layer. CO2 reaching the surface is advected and diffused westwards from the release point under the influence of North Pacific Current. It was confirmed that CO2 hardly crossed the equator into the southern hemisphere although it dispersed extensively in Subtropical Circulation System.
DISCUSSION AND CONCLUSION
(1) Flow fields of the Pacific Ocean were reproduced by using the data assimilation system; in which differences between observed and calculated values of water temperature and salinity were corrected at each time step of calculation (Fig.1). Reproducibility was verified separately for the surface layers where an ample amount of observation data exits and for the middle and deeper layers where such data are scarcely available. The good fitness of the calculation is considered to be owing to the fact that we had estimated the wind stress by utilizing the satellite observation data of SSM/I. Since flow field of the surface layer strongly influenced by wind, determination of the wind stress will be an important factor in OGCM calculations in the future.
(2) We examined feasibility of the CO2 ocean sequestration, using the flow fields obtained by Pacific circulation model. CO2 was supposed to be released in subarctic region of the Northern Pacific Ocean, where has the potential to absorb CO2. Injected CO2 was confined into seawater that was the primary criteria. But biological effects of CO2 on benthos living on sea bottom were also taken into consideration. CO2 injected into 7th layer, which is placed under the thermocline, we could obtain the effective results as follows. Calculation results shows that further eastern sequestration can suppress the reaching of the CO2 in the sea surface layer at the subarctic Northern Pacific region (Table 2). The site differences attain the results, which are shown in Figures 2 and 3 . As shown in Figure 4, most of CO2 injected in subarctic region of the northern Pacific Ocean remained in this area although some part might disperse into southern regions. If the CO2 sequestration technique is to be realized in the future, not only the isolation of adverse effects on marine biota should be taken into consideration.
REFERENCES
Atlas, R., R. Hoffman, S. Bloom, J. Jusem and J. Ardizzone. 1996. A multi-year Global surface wind velocity data set using SSM/I wind observations. Bull. Amer. Meteor. Soc. 77(5).869-882.
Bryan, K. 1969a. A numerical method for the study of the circulation of the world ocean. J. Comput. Phus., 4.347-376.
Fujio, S., T. Kadowaki and N. Imasato. 1992a. World ocean circulation diagnostically derived from hydrographic and wind stress fields 1, The velocity Field. J. Geophys.Res., 97.11163-11176.
Fujio. S., T. Kadowaki and N. Imasato. 1992b. World ocean circulation diagnostically derived from hydrographic and wind stress fields 2, The water movement. J. Geophys. Res.. 97. 14439-14452.
Garratt, J.R. 1997. Review of drag coefficients over oceans and continents, Monthly Weather Review. 105.915-929.
Hasumi, H. 2001. Present state and significant challenge of ocean general circulation model. Oceanography in Japan. 10(1).25-39. (In Japanese).
Hellerman, S. and M. rosenstein. 1983. Normal Monthly wind Stress Over the world Ocean with Error Estimates.Journal of Physical Oceanography. 13. 1093-1104.
Kondo, J. 1975. air-sea bulk transfer coefficients in adiabatic conditions. Bound.-Layer Meteor.. 9.91-112.
Ozaki, M. 2001. dilution discharge technique of released CO2. Kaiyo Monthly. 33(1). 767-774. (In Japanese)
Sarmiento, J.L. and K. Bryan. 1982. an Ocean Transport Model for the North Atlantic. J. Geophys. Res. 87.349-408.
Wada, a. and S. Nagoya. 1996. Pacific ocean flow simulation using the data assimilation system. Flow Modeling and turbulence Measurements VI.631-637.
|