|
POSSIBILITY OF ISOLATION CO2 IN THE HIGH LATITUDE OF THE PACIFIC OCEAN
Kazuyuki Hasegawa1, Akira Wada1, Seiichiro Nagoya2, Kenji Takano3 and Ryosuke Nishimura1
1Nihon University, College of Industrial Technology
Narashino, Chiba, JAPAN
c03810@cit.nihon-u.ac.jp
2Ark Information System, Tokyo, JAPAN
3Columbia University, Lamont-Doherty Earth Observatory, New York, USA
ABSTRACT
As one of measures for controlling the emission of carbon dioxide (CO2) into the atmosphere, attention is focused on making effective use of the ability of the ocean to absorb CO2, and an evaluation is performed on the ability to isolate CO2 from the atmosphere by emitting CO2 into areas deeper than the middle layer of the ocean. The subarctic region of the northern Pacific Ocean has recently been recognized as a sea area, which has the potential to absorb CO2 although oceanographical data of this region are comparatively scarce except for sea areas adjacent to Japan, the Aleutian Islands and the Canadian coast. As this sea region is thought to play decisive roles in the climate fluctuations of the world in the time-scale of decade's years, it is indispensable to correctly evaluate effects of the ocean sequestration of CO2 when this technique would actually be undertaken. Based on the flow fields of the whole Pacific Ocean, which were calculated by the data assimilation system, the authors examined changes in CO2 concentration of the ocean, which may result from CO2 introduction into the subarctic zone of the northern Pacific Ocean.
INTRODUCTION
The global warming, ascribed to increase in greenhouse gas emission by human
activities, has become one of the most serious environmental problems on our planet. The Third Conference
of the Parties (COP3) to the U.N. Framework Convention on Climate Change, which was held in 1997 in Kyoto,
Japan, adopted targets of the cut of greenhouse gas emission form the 1990 level for major industrial
countries. The target for Japan was a 6% cut by 2008. Under these circumstances, a greater amount of attention
has recently been given to the technique of ocean sequestration of carbon dioxide (CO 2),
one of the main greenhouse gases. The CO 2 ocean sequestration technique consists
in directly introducing the man-made CO 2 and dissolving it in seawater of the
deeper layers of ocean. As CO 2 injected into seawater of the deeper layers of
ocean may eventually be dispersed into wider regions of the sea owing to current and diffusion, so it
is necessary to examine the flow field of the ocean. Numerical simulation techniques using ocean circulation
models have been widely employed in complementing for shortcomings of actual observation. Bryan
(1969a) was the first to introduce for this purpose the Primitive Equation Systems, which has influenced
almost all Ocean General Circulation Models (OGCM) until now ( Hasumi, 2001).
Accuracy of numerical simulation results is an important factor in estimating the effectiveness of CO 2
ocean sequestration. We used the method of Sarmiento and Bryan (1982), in which differences between observed
and calculated values are corrected at each time step of calculation, thus enabling to simulate a realistic
flow field based upon observation results. Instead of using the wind stress at sea surface calculated
from buoy and shipboard data by the method of Hellerman et al. (1983),
which has been adopted in many of OGCM, we utilized the satellite observation data of wind speed (Special
Sensor Microwave/Imager: SSN/1) that were converted to wind stress by the Bulk equation. Finally, we examined
the feasibility of ocean sequestration technique for a case in which the CO 2
in surplus of the emission cut targeted for Japan in COP3 was introduced into the Pacific Ocean, and discussed
a proper regions of water into which CO 2 should be introduced if the object
of CO 2 sequestration is to be attained.
PACIFIC OCEAN CIRCULATION MODEL
Model Description
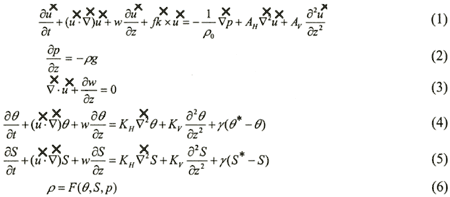
Calculation covered the entire Pacific Ocean. The calculation mesh in the horizontal direction was longitude-latitude 2°x 2°(110E〜70W, 60N〜74S). We assumed eleven vertical layers as shown in Table 1. The coordinate system is spherical coordinate to horizontal direction. The equations used are equation of motion (1), hydrostatic approximation equation (2), continuity equation (3), equation of heat conservation (4), salinity conservation equation (5) and condition equation (6).

 the
horizontal flow velocity  the
horizontal gradient operator and  2 2
the horizontal Laplacian operator of spherical coordinate,  u
nit vector of triaxial reference system, w the vertical flow velocity, p is pressure, ρ
is density, θ,θ * the calculated value of potential water temperature and observed
value of potential water temperature, respectively, S,S* the calculated
value of salinity and observed value of salinity respectively, f the Coriolis parameter, g
the acceleration of gravity, γ the corrected term. AH the coefficient of horizontal eddy viscosity (1.0 x
10 7cm 2/s), Av the
coefficient of vertical eddy viscosity (1.0 x 10 2 cm 2/s),
K H the coefficient of horizontal eddy diffusion (1.0 x 10 6cm 2/s)
and Kv the coefficient of vertical eddy diffusion (1.0 x 10 cm 2/s), its
value is set up based on the value that Wada et al. (1996) used for calculation.
Table 1. Depths and Thickness of Model Levels
Data assimilation method
We introduced a term that assimilates calculated value and observed value in the salinity conservation equation and heat conservation equation after Sarmiento and Bryan (1982).
γ=γD+(γs-γD)e-z/h (7)
γs the sea surface value (1/50 days=2.31 x 10⁻⁷ sec-1),γD the value in deep water (1/250 day=4.6 x 10⁻⁸ sec-1), z the calculated depth, h the influenced depth of assimilation terms (=500 m).
By equation (7), observed data are assimilated continuously to a model through
the assimilated term. When a calculated value deviates from an observed value, the assimilated term becomes
bigger and works to return the calculated value to observed value ( Fujio et al.,
1992a, 1992b).
Data used
Wind stress was calculated from satellite observed data sets (SSM/I: (1988〜1998))
( Atlas et al., 1996) and the data were applied to a model. For calculation
of wind stress, a bulk method was adopted ( Garratt, 1997). This method evaluates
the flux using the observation values at optional height on water surface. The flux calculation formula
is given below:
τx=ρaCD|V|ua : East-West component of wind stress (8)
τy=ρaCD|V|va : South-North component of wind stress (9)
ρ a the air density, | V| the absolute value
of wind speed, u a and v a are East-West and South-North
components of wind speed (wind speed value measured at 10m high is used). CD
the Bulk coefficient (conversion coefficient for kinetic momentum) estimated by Kondo
(1975). Generally, the value of C D is determined by wind speed or by a function
of wind speed and stability. As there are areas where tropical (10°S 120°E, 120°E 170°E) and sub-tropical
(30°N, 35°S) area winds converge and have small value, it was necessary to meticulously define a bulk
coefficient at breeze. As for water temperature and salinity data, we used data in the area between 100°E〜60°W,
during about 80 years (1906〜1988), stored by JODC. For sea bottom topography are used the General Bathymetric
Chart of the Oceans (GEBCO) published by the Canadian Hydrographic Service.
FLOW ANALYSIS RESULT
Surface layer circulation
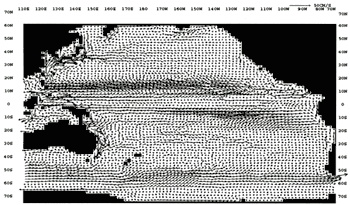
Figure 1 shows the calculated horizontal current field (water depth 10 m) after 30 years. The Northern Equatorial Current, the Kuroshio, California Current and the clockwise North Pacific sub-tropical circulation are reproduced. In the southern hemisphere, the South Equatorial Current, the Antarctic Circumpolar Current, the East Australia Current and the counter-clockwise South Pacific sub-tropical belt circulation are reproduced. In addition, detailed examination of the numerical results shows that the Equatorial Countercurrent, the Oyashio and the Subtropical Counter current are also well reproduced.
| (Enlarge: 88KB) |
 |
Figure 1. The calculated horizontal current field (water depth 10 m) after
30 years
|