|
EXAMPLE OF APPLICATION
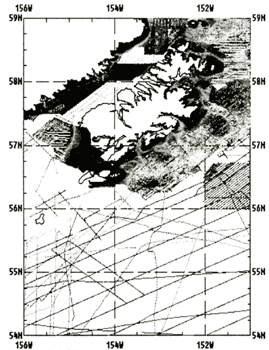
We shall illustrate application of such a technology of the gridded digital bathymetry creating on an example of obtaining the array of depths for small region in a northern part of Pacific around Kodiak Island. In this 5 x 5 degrees area (between 54th to 59th degrees North latitude and from 156th to 151st degrees West longitude) the detailed gridded bathymetry with resolution of 30 arc seconds in both directions was created. Available depth sounding data with the coastline from "Marine Trackline Data" and "Hydrographic Survey Data" sources are presented in the Figure 2. It is seen that in shelf zone the density of sounding measurements is rather higher than in deep ocean. In this area 600 x 600 points array of depth values was created using linear and spline interpolation methods. Both obtained digital arrays are visualized in Figure 3 as a 3-D shaded relief. This style of visualization makes all small-sized details of a bottom relief be very well visible (Fig.3). Here the illumination vector is directed from the upper left corner of the area. In the bottom part of the left picture that is correspond to linear interpolation algorithm, some "star" structures around local depth extremums are visible. In this part of area depth soundings traces are located rather far from each other (Fig.2).
 Figure 2. marine Trackline data for the area around Kodiak Island in the
North Pacific
Figure 3. Three-dimensional shaded images of the bottom relief (gridded
bathymetry) that had been created using linear interpolation (left) and spline interpolation (right) methods
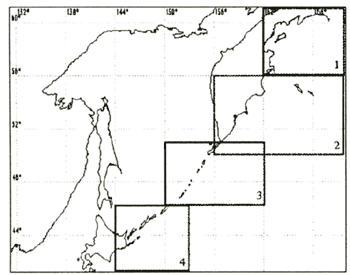
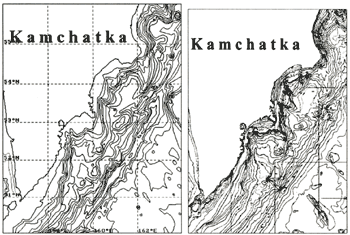
For some areas of interest the information about depths from these global databases is insufficient for obtaining high quality gridded bathymetry. But if the paper bathymetry charts are available, it is possible to apply technologies for digitizing geographic information developed earlier by one author (Marchuk, 1996) and methods proposed in this paper. For example, the information about depths for Kuril-Kamchatka area in that both global data sets are insufficient for our purposes. So the set of four detailed bathymetry charts for this region were prepared in Kamchatka Institute of Volcanology. Figure 4 shows the coverage of these charts. In Figure 5 the GEBCO isolines of depth (left) and scanned image of one of this bathymetric chart (right) are shown. Using this data source (paper charts) makes it possible to create the new 1-min gridded digital bathymetry for that region. Comparison of several different gridded bathymetry sets (5-min ETOPO5, 2-min Sandwell's and the one developed by authors) can be found on our web site ( http://omzg.sscc.ru/tsulab/ the item "Kuril-Kamchatka Bathymetry Project"). Now 1-minute gridded bathymetry was produced for areas 1-4 using linear interpolation method and 0.5-min bathymetry arrays, which were produced by spline interpolation, are ready for areas 2 and 3. Bathymetry arrays of this resolution for the last two areas will be completed in near future. As an example, the 3-D shaded relief of the area 2 is shown in Figure 6.
 Figure 4. Geographic coverage of specially prepared bathymetric charts
| (Enlarge: 95KB) |
 |
Figure 5. Comparison of the depths isolines sets from GEBCO database and
specially prepared bathymetric chart.
Figure 6. 3-D shaded bottom relief of the South Kamchatka area
CONCLUSION
For some regions of World ocean the quality of bathymetric data (on a random grid) that is contained in global databases allows to create rather detailed gridded digital bathymetry using proposed methods. If the number of depth measurements is insufficient, then additional sources of bathymetric information can be used. New digital bathymetry on a regular grid for the Kuril-Kamchatka region was created using the described in this paper technology and some numerical experiments of tsunami propagation was carried out.
ACKNOWLEDGMENTS
The work was supported by RFBR grant O1-01-00817(a) and CRDF award RG1-2415-NO-02.
REFERENCES
GEBCO 97, Digital Atlas CD-ROM. 1997. Intergovernmental Oceanographic Commission, International Hydrographic Organization. British Oceanographic Data Centre, Proudman Oceanographic Laboratory. Bidston Observatory, Birkenhead Merseyside L43 7RA, United Kingdom.
Hydrographic Survey Data, CD-ROM data set, Ver. 3.2, National Ocean Service, NGDC, NOAA, E/GC3, 325 Broadway, Boulder, CO.
Marchuk, An. G. 1996. Interactive system for input digital geographic and bathymetric information. Bulletin of the Novosibirsk Computing center. Series: Mathematical Modeling in Geophysics, Issue: 2 (1996), NCC Publisher, Novosibirsk: 55-62.
Marine Geological and Geophysical Data from NGDC, Compact disc data set, National Geophysical Data Center, Boulder, Colorado, USA.
Smith, W.H.F. and Sandwell, D. 1997. Global seafloor topography from satellite altimetry and ship depth soundings. Science. 277:1956-1962.
|