China (2)
| |
丂丂Edited by |
|
|
| |
丂丂Li Lianjun |
|
1990057 |
| |
丂丂Li K.Xingang |
|
1996002 |
丂
WMU Japan Sasakawa Fellows Forum July 23-25, 2001
丂
COUNTRY REPORT: THE HONG KONG SPECIAL ADMINISTRATIVE REGION OF THE PEOPLE'S REPUBLIC OF CHINA
丂
| |
BY |
|
| 丂丂LIANJUN LI |
|
K.X. LI |
| 丂丂(GMA, 1990) |
|
(SM (C) - 1996) |
| 丂丂SINCLAIR ROCHE & TEMPERLEY |
|
THE LONDON P&J CLUB |
| 丂丂42A Bank of China Tower |
|
1505 Guardian House |
| 丂丂No. 1 Garden Road |
|
32 Oil Kwan Road |
| 丂丂Hong Kong |
|
Hong Kong |
| 丂丂Tel: (852) 28200200 |
|
Tel: (852) 25739293 |
| 丂丂Fax: (852) 28459244 |
|
Fax: (852) 28382001 |
| 丂丂Email: lianjun.li@srtlaw.com.hk |
|
Email: kxl@a-bilbrough.com.hk |
丂
丂
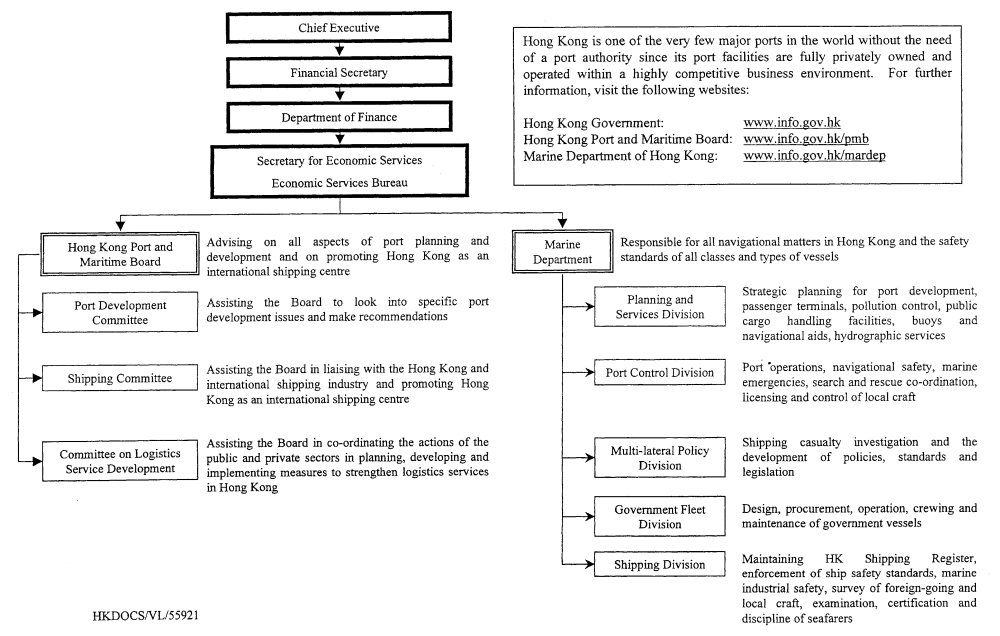
An Outline of Maritime Administrative Organisations in Hong Kong
乮奼戝夋柺丗 132 KB乯
丂
丂
Basic Data on Marine Transport of Hong Kong
(I) Role of marine transport
丂
1. International marine transport trade amount and percentage in Hong Kong's entire international trade
| Year |
Export(Unit: HKD 1 million) |
Import(Unit: HKD 1 million) |
| Marine |
Total |
Marine(亾) |
Marine |
Total |
Marine(亾) |
| 1998 |
$698,131.00 |
$1,347,649.00 |
51.80亾 |
$556,151.00 |
$1,429,092.00 |
38.92亾 |
| 1999 |
$669,678.00 |
$1,349,000.00 |
49.64亾 |
$472,065.00 |
$1,392,718.00 |
33.90亾 |
| 2000 |
$742,421.00 |
$1,572,689.00 |
47.21亾 |
$524,902.00 |
$1,657,962.00 |
31.66亾 |
丂
2. Total tonnage of cargo carried by mode of transport
| Year |
Mode of Tiansport (Unit: 1,000 tonnes) |
| Ocean Vessel |
River Cargo Vessel |
Air |
Rail |
Road |
Total |
| 1998 |
127,482
(62.06亾) |
39,688
(19.32亾) |
1,629
(0.79亾) |
462
(0.22亾) |
36, 152
( 17.60亾) |
205,413
( 100亾) |
| 1999 |
128,222
(61.11亾) |
40,616
(19.36亾) |
1,974
(0.94亾) |
466
(0.22亾) |
38,553
(18.37亾) |
209,831
( 100亾) |
| 2000* |
97,390
(56.26亾) |
31,764
(18.35亾) |
2,240
(1.29亾) |
451
(0.26亾) |
41,250
(23.83亾) |
173,095
(100亾) |
* Figures from Jan 2000 to Sept 2000
丂
3. Marine passenger transport amount and percentage in Hon Kong's entire domestic passenger transport
| Year |
Mode of Transport (Unit:1,000) |
| Arrivals |
Departures |
| Air |
Sea |
Land |
Total |
Air |
Sea |
Land |
Total |
| 1995 |
10,630
(23.05亾) |
10,332
(22.41亾) |
25,150
(54.54亾) |
46,112
(100亾) |
10,739
(23.34亾) |
10,572
(22.98亾) |
24,703
(53.69亾) |
46,014
(100亾) |
| 1999 |
10,699
(16.57亾) |
8,543
(13.23亾) |
45,318
(70.20亾) |
64,560
(100亾) |
10,623
(16.48亾) |
8,898
(13.80亾) |
44,954
(69.72亾) |
64,475
(100亾) |
| 2000 |
11,566
(16.06&) |
9,421
(13.08亾) |
51,048
(70.87亾) |
72,035
(100亾) |
11,458
(15.93亾) |
9,818
(13.65亾) |
50,662
(70.42亾) |
71,938
(100亾) |
丂
丂
(II) Magnitude of merchant fleets
丂
丂丂Size of national fleet of oceangoing vessels and the fleet of domestic shipping vessels
| Year |
Oceangoing
vessels |
Domestic vessels |
Total Number |
Total gross
tonnage |
| 1998 |
186 |
293 |
479 |
6,212,516 |
| 1999 |
276 |
245 |
521 |
8,337,884 |
| 2000 |
341 |
236 |
577 |
10,397,08 |
丂
丂
(III) Seafarers
丂
丂丂Number of seafarers registered in Hong Kong
| Year |
Number |
| 1998 |
3,414 |
| 1999 |
3,491 |
| 2000 |
3,611 |
丂
丂
(IV) Ports
丂
1 . Amount of cargos handled at Hong Kong port
| Year |
Total cargo throughput (Unit: 1,000 tonnes) |
| Seaborne |
River |
Total |
| 1998 |
127,482 |
39,688 |
167,170 |
| 1999 |
128,222 |
40,616 |
168,838 |
| 2000 |
130,936 |
43,706 |
174,642 |
丂
2. Number of oceangoing/domestic shipping vessels entering Hong Kong port
| Year |
Vessels arriving in Hong Kong ports |
| Ocean Vessels |
River Passenger Vessels |
River Cargo Vessels |
Total |
| Number |
Capacity* |
Number |
Capacity* |
Number |
Capacity* |
Number |
Capacity* |
| 1998 |
41,690 |
208,577 |
65,000 |
9,491 |
124,610 |
43,626 |
231,300 |
261,694 |
| 1999 |
37,570 |
215,404 |
59,930 |
8,804 |
115,330 |
43,047 |
212,830 |
267,255 |
| 2000 |
37,680 |
243,256 |
59,810 |
8,952 |
119,180 |
48,397 |
216,670 |
300,605 |
*Capacity is in the unit of 1.000 NRT
丂
丂
(V) Occurrence of marine disasters and marine pollution
丂
1. Number of recent marine disasters occurred in Hong Kong's territorial waters or involving Hong Kong flag's vessels
| Year |
No. of accidents reported |
Persons killed or iniured |
No. of collision cases |
| 1998 |
364 |
59 |
253 |
| 1999 |
441 |
97 |
261 |
| 2000 |
473 |
91 |
275 |
丂
2. Number of recent marine pollution occurred in Hong Kong territorial waters or involving Hong Kong flag's vessels
| Year |
Oil pollution incidents tackles (in cases) |
| 1998 |
94 |
| 1999 |
85 |
| 2000 |
92 |
|
|