Ocean Disposal Database
Amount of Dredged Material Disposed By Region in Cubic Meters (F=Federal,P=Permit)
Click here to report volumes in (Cubic Yards) or view data graphically.
(2)海域別海洋投棄量
| Year |
Federal/Permit |
Atlantic |
Gulf |
Pacific |
Total Disposed |
| 1976 |
P |
964,925 |
406,308 |
213,706 |
1,584,939 |
| 1976 |
F |
17,694,067 |
23,923,646 |
8,492,116 |
50,109,830 |
| 1977 |
P |
2,222,922 |
972,036 |
977,618 |
4,172,575 |
| 1977 |
F |
14,739,194 |
8,726,303 |
10,143,337 |
33,608,834 |
| 1978 |
P |
3,434,966 |
|
1,503,204 |
4,938,169 |
| 1978 |
F |
14,130,267 |
14,642,702 |
6,836,594 |
35,609,563 |
| 1979 |
P |
3,014,436 |
|
103,527 |
3,117,962 |
| 1979 |
F |
9,323,456 |
35,479,275 |
7,733,086 |
52,535,817 |
| 1980 |
P |
1,227,030 |
|
107,885 |
1,334,915 |
| 1980 |
F |
12,472,385 |
17,337,458 |
3,965,369 |
33,775,211 |
| 1981 |
P |
1,340,114 |
|
439,645 |
1,779,759 |
| 1981 |
F |
6,998,613 |
27,596,784 |
6,074,518 |
40,669,915 |
| 1982 |
P |
2,381,347 |
252,547 |
482,463 |
3,116,357 |
| 1982 |
F |
10,208,939 |
10,191,048 |
5,204,326 |
25,604,313 |
| 1983 |
P |
1,926,257 |
706,873 |
1,494,028 |
4,127,158 |
| 1983 |
F |
8,638,680 |
27,963,028 |
4,741,896 |
41,343,604 |
| 1984 |
P |
4,061,861 |
574,597 |
2,508,117 |
7,144,575 |
| 1984 |
F |
8,964,094 |
24,308,316 |
9,555,229 |
42,827,639 |
| 1985 |
P |
1,010,190 |
|
683,399 |
1,693,589 |
| 1985 |
F |
10,861,755 |
29,450,404 |
9,196,074 |
49,508,232 |
| 1986 |
P |
1,082,903 |
231,062 |
682,941 |
1,996,906 |
| 1986 |
F |
10,135,843 |
22,299,788 |
8,663,874 |
41,099,506 |
| 1987 |
P |
6,356,273 |
|
1,986,278 |
8,342,551 |
| 1987 |
F |
12,513,749 |
32,021,677 |
5,953,023 |
50,488,450 |
| 1988 |
P |
2,901,733 |
3,134,860 |
731,722 |
6,768,316 |
| 1988 |
F |
14,148,082 |
19,408,148 |
7,119,802 |
40,676,032 |
| 1989 |
P |
4,436,897 |
|
805,359 |
5,242,256 |
| 1989 |
F |
15,996,732 |
27,874,411 |
7,108,486 |
50,979,629 |
| 1990 |
P |
856,505 |
|
680,876 |
1,537,381 |
| 1990 |
F |
5,746,045 |
22,630,249 |
12,783,042 |
41,159,336 |
| 1991 |
P |
616,650 |
|
267,610 |
884,260 |
| 1991 |
F |
5,229,864 |
29,196,633 |
5,229,023 |
39,655,520 |
| 1992 |
P |
2,595,358 |
128,606 |
277,091 |
3,001,055 |
| 1992 |
F |
12,501,439 |
34,707,335 |
1,703,223 |
48,911,997 |
| 1993 |
P |
7,575,045 |
229,380 |
1,991,095 |
9,795,520 |
| 1993 |
F |
8,266,702 |
31,894,677 |
5,055,459 |
45,216,838 |
| 1994 |
P |
1,309,683 |
|
25,232 |
1,334,915 |
| 1994 |
F |
10,515,162 |
23,450,970 |
4,932,435 |
38,898,566 |
| 1995 |
P |
762,773 |
|
261,264 |
1,024,037 |
| 1995 |
F |
9,769,812 |
40,291,667 |
5,739,852 |
55,801,331 |
| 1996 |
P |
3,049,775 |
|
857,347 |
3,907,122 |
| 1996 |
F |
6,636,616 |
29,479,382 |
1,278,794 |
37,394,791 |
| 1997 |
P |
3,149,254 |
|
1,546,400 |
4,695,654 |
| 1997 |
F |
6,458,776 |
36,165,921 |
6,372,995 |
48,997,691 |
| 1998 |
P |
1,657,882 |
|
5,821,053 |
7,478,935 |
| 1998 |
F |
7,400,105 |
33,942,582 |
7,156,809 |
48,499,496 |
| 1999 |
P |
1,307,313 |
|
3,485,353 |
4,792,666 |
| 1999 |
F |
9,554,977 |
25,449,023 |
5,613,627 |
40,617,626 |
| 2000 |
P |
2,007,304 |
|
148,638 |
2,155,943 |
| 2000 |
F |
24,528,827 |
30,090,298 |
1,950,648 |
56,569,772 |
Ocean Disposal Database
Amount of Dredged Material Disposed By Year in Cubic Meters for All Districts
Click here to report volumes in (Cubic Yards) or view data graphically.
(6)年別海洋投棄量(総量)
Home
| Year |
Quantity Disposed |
| 1976 |
51,694,769 |
| 1977 |
37,781,409 |
| 1978 |
40,547,732 |
| 1979 |
55,653,780 |
| 1980 |
35,110,126 |
| 1981 |
42,449,674 |
| 1982 |
28,720,670 |
| 1983 |
45,470,762 |
| 1984 |
49,972,215 |
| 1985 |
51,201,821 |
| 1986 |
43,096,411 |
| 1987 |
58,831,000 |
| 1988 |
47,444,348 |
| 1989 |
56,221,884 |
| 1990 |
42,696,717 |
| 1991 |
40,539,780 |
| 1992 |
51,913,052 |
| 1993 |
55,012,358 |
| 1994 |
40,233,481 |
| 1995 |
56,825,369 |
| 1996 |
41,301,914 |
| 1997 |
53,693,345 |
| 1998 |
55,978,430 |
| 1999 |
45,410,292 |
| 2000 |
58,725,715 |
Ocean Disposal Database
Amount of Dredged Material Excluded From Testing By Year in Cubic Meters for All Districts
Click here to report volumes in (Cubic Yards) or view data in graphically
(7) 事前試験が免除された事業数と浚渫物量(年別)
Home
| Year |
Amoount Excluded |
Number of Projects |
| 1977 |
473,899 |
3 |
| 1978 |
6,768,698 |
7 |
| 1979 |
1,349,135 |
6 |
| 1980 |
308,363 |
5 |
| 1981 |
1,641,061 |
5 |
| 1982 |
1,291,868 |
5 |
| 1983 |
1,259,449 |
4 |
| 1984 |
719,282 |
6 |
| 1985 |
1,449,911 |
7 |
| 1986 |
1,628,177 |
7 |
| 1987 |
5,640,760 |
19 |
| 1988 |
9,547,943 |
20 |
| 1989 |
11,563,357 |
33 |
| 1990 |
17,494,124 |
31 |
| 1991 |
7,451,715 |
35 |
| 1992 |
2,301,293 |
15 |
| 1993 |
3,417,533 |
10 |
| 1994 |
831,885 |
2 |
| 1995 |
1,114,099 |
2 |
| 1996 |
138,393 |
5 |
| 1997 |
941,528 |
2 |
| 1998 |
3,310,489 |
1 |
| 1999 |
4,967,606 |
13 |
| 2000 |
8,228,396 |
12 |
Ocean Disposal Database
Total Number of Ocean Disposal projects
Home
(8)年別投棄事業数
* View data graphically
| Year |
Total |
Federal |
Permit |
| 1976 |
110 |
77 |
33 |
| 1977 |
99 |
62 |
37 |
| 1978 |
88 |
58 |
30 |
| 1979 |
86 |
60 |
26 |
| 1980 |
80 |
52 |
28 |
| 1981 |
83 |
47 |
36 |
| 1982 |
102 |
52 |
50 |
| 1983 |
95 |
49 |
46 |
| 1984 |
102 |
49 |
53 |
| 1985 |
105 |
56 |
49 |
| 1986 |
97 |
50 |
47 |
| 1987 |
93 |
56 |
37 |
| 1988 |
74 |
44 |
30 |
| 1989 |
85 |
51 |
34 |
| 1990 |
86 |
51 |
35 |
| 1991 |
82 |
43 |
39 |
| 1992 |
68 |
34 |
34 |
| 1993 |
64 |
41 |
23 |
| 1994 |
63 |
43 |
20 |
| 1995 |
69 |
51 |
18 |
| 1996 |
46 |
35 |
11 |
| 1997 |
66 |
48 |
18 |
| 1998 |
65 |
47 |
18 |
| 1999 |
78 |
51 |
27 |
| 2000 |
72 |
49 |
23 |
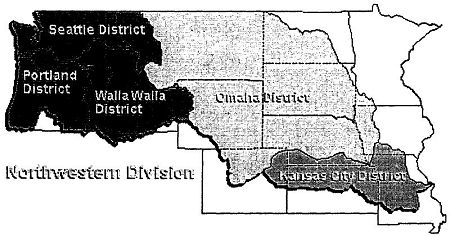
Ocean Disposal Database
Home / Division Map
*Click on the district to see its disposal sites.
{The Mouth of columbia River Site E (1997--) and Coos Bay Entrance F (1994--) disposal sites have bathymetry data available.}
* Only the Portland and Seattle Districts are included in the ODD .
地域別の地図1(北西部の画面。この画面の場合、 シアトル地域またはポートランド地域をダブルクリックするとさらに細かい地点の情報が得られる)
|
|