The effectiveness of the liquefaction potential test should be evaluated whether the degree of saturation after drainage can be a good indicator of liquefaction potential or not.
5 Effectiveness of new test procedure
5.1 International collaboration program on the evaluation of the effectiveness of liquefaction potential test
At the fourth session of DSC Sub-Committee, following the discussion on the new test procedure (3)・(8), it was agreed to establish a Correspondence Group on the evaluation of the effectiveness of the liquefaction potential test under the coordination of Japan. Australia. Canada and Poland joined the Correspondence Group. By the group, the scope of the application of the requirement for materials which may liquefy in each country was investigated (9). After that, various tests were carried out by Japan and Poland to acquire the data for evaluating the effectiveness of the liquefaction potential test. Following are the summary of the results and the detailed results are given in the report of the Correspondence Group (10).
5.2 Samples for the tests
In the work of the Correspondence Group, we used samples of following five materials:
・ Zinc Concentrate;
・ Copper Concentrate;
・ Carol Lake Iron Ore Concentrate;
・ Sedimentary Galena; and
・ Granulated Nickel Slag.
Hereafter, these materials are denoted by, Zinc Conc., Copper Conc.. Iron Conc., Galena and Nickel Slag.
Zinc Conc. and Copper Conc. are the typical materials which may liquefy. Iron Conc., sent by Canada, is the comparatively coarse material which is empirically judged as a material which may liquefy. Galena, sent by Poland, is the comparatively fine material which is empirically judged which is not liable to liquefy. Nickel Slag is the typical material which is not liable to liquefy.
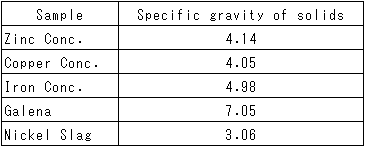
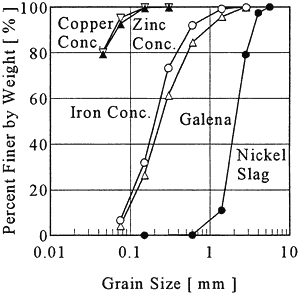
5.3 Specific gravity of solids and grain size distributions
Specific gravity of solids of each sample is given in Table 1. Figure 2 shows the grain size accumulation curves of the samples. The grain size distributions of Iron Conc. and Galena are close to each other.
Fig. 2 Grain size distribution
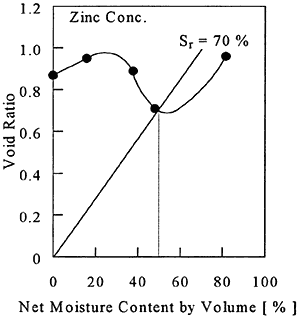
5.4 Proctor/Fagerberg Test
Proctor/Fagerberg Test described in Appendix D.1.3 of the BC Code was carried out. In the test, sample is inserted in the mould under the specified compaction condition and the weight and moisture content are measured. The results of the test is shown in the graph of which the abscissa and ordinate are net moisture content by volume and void ratio, respectively. TML is determined at the moisture content corresponding to the degree of saturation 70 %. Fig. 3 to Fig. 7 show the results of the tests.
Fig. 3 Compaction curve for Zinc Conc.