Figures 4.1 to 4.5 show the relations between moisture content (wet basis) and dry bulk density of the samples obtained through the tests by Japan, for reference. In each figure, monotonous curves correspond to degree of saturation 10% to 100%.
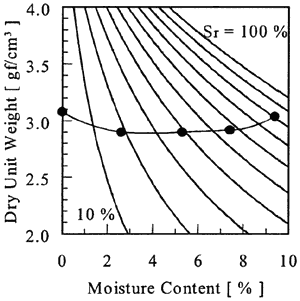
Fig. 4.1 Compaction Curve for Iron Conc.
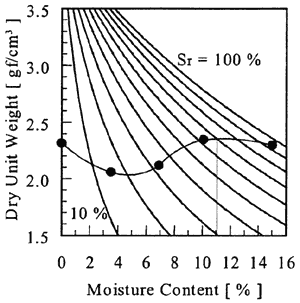
Fig. 4.2 Compaction Curve for Copper Conc.
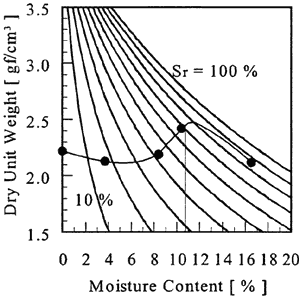
Fig. 4.3 Compaction Curve for Zinc Conc.
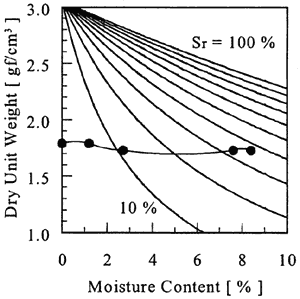
Fig. 4.4 Compaction Curve for Nickel Slag
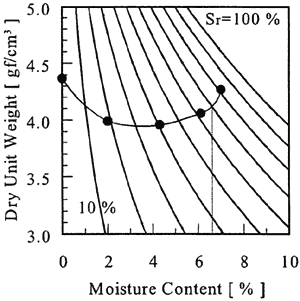
Fig. 4.5 Compaction Curve for Galena
前ページ 目次へ 次ページ