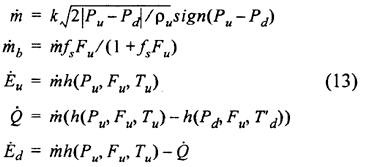
and the temperature of the air entering the air-receiver T'd is given as
T'd = Tuε(Tu - Tw) (14)
The required input data to this simplified model is the average heat coefficient, the heat exchanger area and a scaling factor for the heat exchanger efficiency. This scaling factor may be given dependent of engine load.
4.5 Turbocharger
The turbocharger of a modern diesel-engine is a highly sophisticated machine which from a system dynamic approach consists of mainly two components. The turbine which expands the high pressure exhaust gas coming from the cylinders of the engine and the compressor utilizing the excess power from the turbine to compress air which in turn is delivered to the air-receiver. In turbocharger applications the compressor is most often of the radial compressor type, while the turbine may be of the axial or radial type.
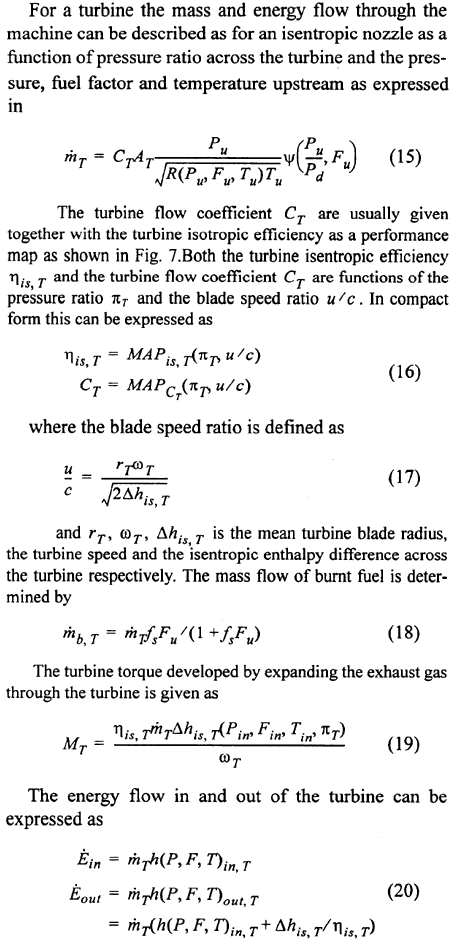
In developing models for the turbocharger different approaches may be taken. Starting from the fundamental equations for the turbo machine may lead to a correct model, but the number of approximations that must be introduced soon give a model of limited accuracy or validity. In modeling turbochargers for steady state or transient performance simulations of the total engine system, the performance maps for the turbine and compressor available from the manufacturers are used to represent the model equations.
Fig. 7. Turbine performance map
Turbine

Reviewing the equations derived we can graphically express the model of a turbine as a pseudo bond graph R-field as shown in Fig. 9. The forced causalities resulting from our selection to use the performance maps as model equations, are indicated on the figure.
This bond graph now represents any turbine that can be described using performance maps as shown. Both axial and radial turbines fits normally nicely into this structure only differing in input data. Additional empirical equations correcting the mass and energy flow for pulsating flow upstream of the turbine are allowed for.
The input data required for the model are in addition to the turbine performance map giving the turbine isentropic efficiency and flow coefficient for the particular turbine, the turbine flow area and the mean blade radius.
Compressor
The compressor performance characteristics are given in performance maps as shown in Fig. 8, which expresses the relations between pressure ratio over the compressor πc, the compressor speed ωc, volume flow rate V and isentropic efficiency.x Selecting the pressure ratio and the turbocharger speed as known variables, the mass flow and the isentropic effciensy can be established from the performance map.