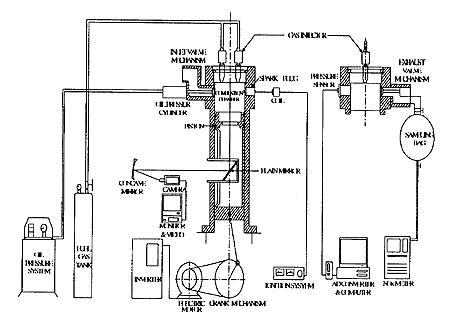
Fig.7 Schematic view of experimental system
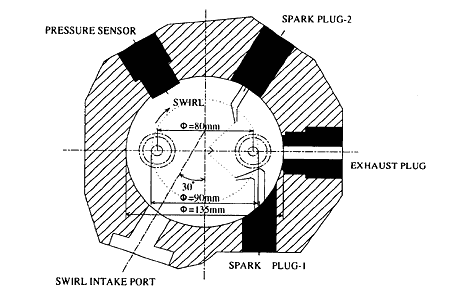
Fig.8 Cross-sectional view of the combustion space
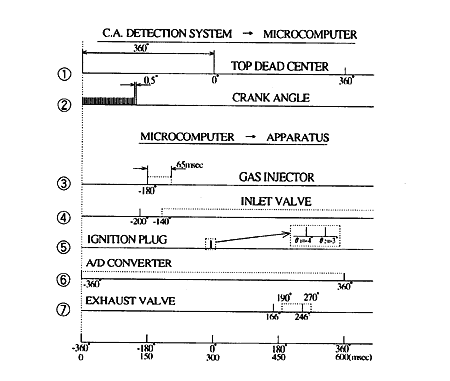
Fig.9 Timing chart for system control
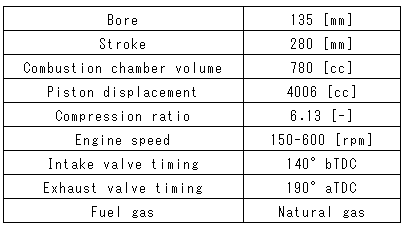
Table 1 Specifications of Test Engine
When the ignition timings of two igniters are adjusted, the combustion processes for the injection timings of -120°CA have changed as shown in Fig.10. The corresponding performances of the cycle are also illustrated in Fig.11. From those figures, it is recognized that the ignition at the optimum position in the diffusing zone of a fuel mixture. The ignition timings of (-6°,-4°), and (-4°,-3°) give a preferable stability for the combustion process without a considerable change in Pmi or NOx emission. Where, the cycle stability, σ is defined as a standard deviation of the maximum pressure in the test cycles.
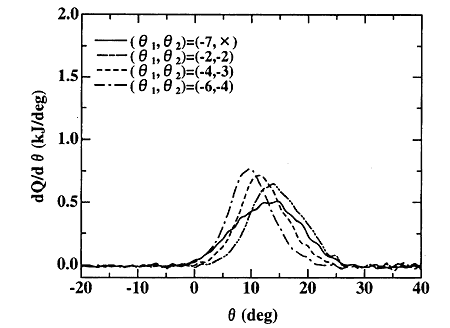
Fig.10 Change of heat release with ignition timing
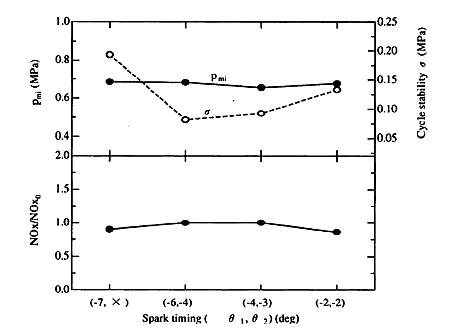
Fig.11 Change of cycle performance with heat release processes in Fig.10
BACK CONTENTS NEXT