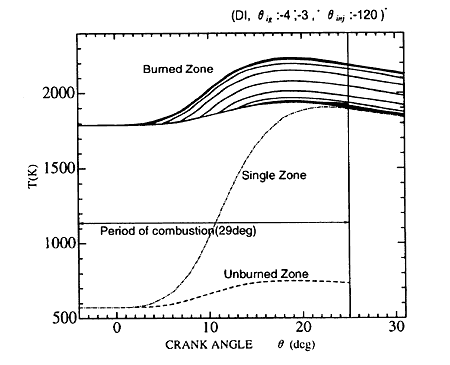
Fig.4 Temperature change in the multi layers
Fig.4 shows the temperature change of each layer calculated by the multi-zone model. As the combustion in the cylinder progresses, the adiabatic equilibrium temperature of the zone gradually increases according to the compression of the unburned part, but the maximum temperature in the successive zone decreases due to expansion in the work process.
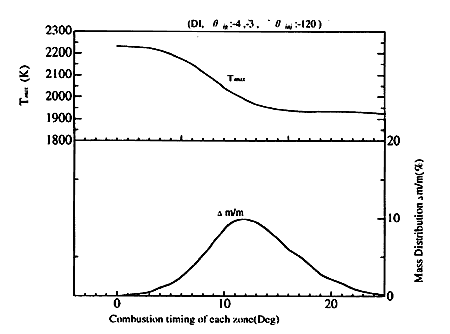
Because of the adiabatic compression of the burnt part, the temperature path corresponding to the burnt part in the first step lies highest in the figure. Each high temperature part contributes to formation of NOx. Though a mass contained in o the burnt part per 1。?A differs depending on the combustion timing, the evaluation of a local temperature is important, since the high temperature exponentially affects the rate of NOx formation. The change of the maximum temperature of the burnt part, and the corresponding mass fraction are plotted in Fig.5.

Fig.5 Maximum temperature and burnt mass fraction
4. FLOW CHART OF CALCULATION
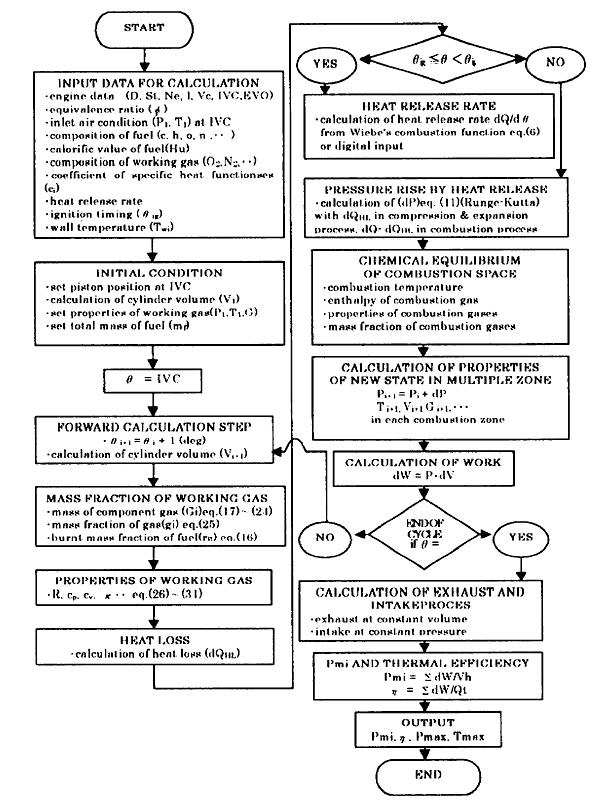
The calculating procedure for the present cycle simulation is shown as the flow chart in Fig.6.
As described above, an incremental pressure dP during one step is calculated from the heat evolved dQ during the step. The heat can be calculated from a given heat release rate at the step. The adiabatic equilibrium combustion temperature in the reacting zone is simultaneously determined. During the process, the total mass of fuel and air (?m), which brings on the released heat of dQ, flows into the reaction zone, and then the zone is turned to the burnt zone after reaction. After the flame propagates throughout the combustion chamber, the combustion process terminates, and only the burnt zone is finally left in the chamber.
Including the above combustion process, the state of the working gas is calculated throughout the cycle. The indicated mean effective pressure, fuel consumption rate, efficiency of the cycle, etc are determined from the calculated properties of state.

Fig.6 Calculation flow chart
5. EXPERIMENTS
To verify the applicability of those models, the combustion tests were carried out using a single cylinder test apparatus as shown in Fig 7. The test engine equipped with two ignition sources and two injectors can operate with either a premixed charge or a direct fuel injection. The cross-sectional view of the combustion space is illustrated in Fig.8.
The ignition timings are independently controlled to give different types of heat release rate. When coupled with altering the injection timings, a great many heat release process has been realized. Timing chart for controlling the experimental system is shown in Fig.9.The timing pulses from the crank angle encoder control the experimental processes to measure the indicated pressure, and to observe the flame behaviors using a high speed photography.
BACK CONTENTS NEXT