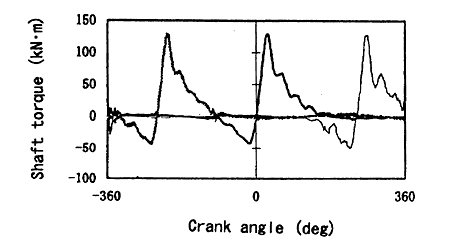
Fig. 12-1 Engine normal condition
丂
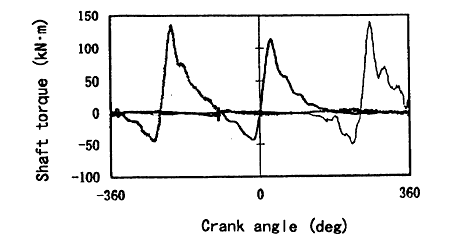
Fig. 12-2 No. 1 cylinder blocked nozzle condition
丂
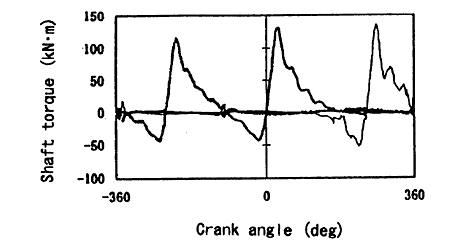
Fig. 12-3 No. 2 cylinder blocked nozzle condition
丂
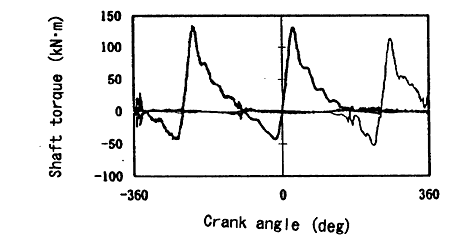
Fig. 12-4 No. 3 cylinder blocked nozzle condition
丂
3. 6. 2 Display of the Diagnosis results
The peak torque values of each cylinder being found out by the analyzing results from the previous clause can be, displayed in Fig. 13 by mean value deviation method. The maximum and minimum values are excluded from the data of each cylinder and the remaining data are simply leveled for making them the standard values and the ratio of each cylinder's value is shown by the percentage.
丂
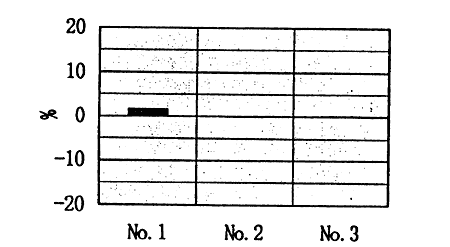
Fig. 13-1 Engine normal condition
丂
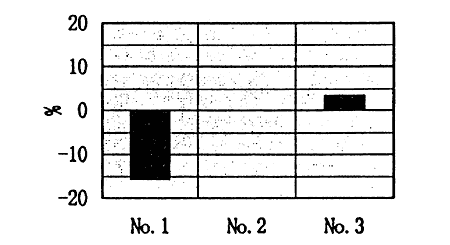
Fig. 13-2 No. 1 cylinder blocked nozzle condition
丂
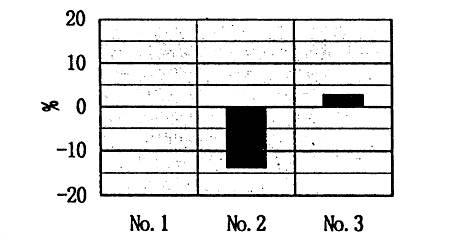
Fig. 13-3 No. 2 cylinder blocked nozzle condition
丂
丂
丂
BACK丂丂丂CONTENTS丂丂丂NEXT
丂