Fig. 10 Contribution rate revised coefficient
3. 5 Comparison results between the gas pressure in cylinder method and the contribution rate method.
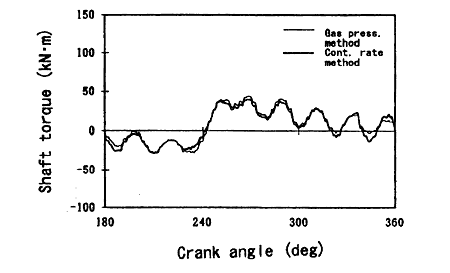
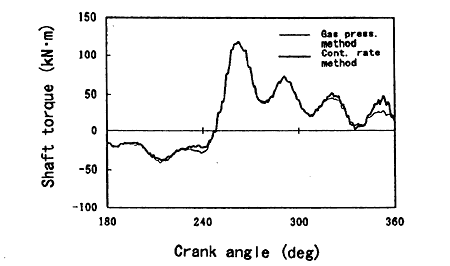
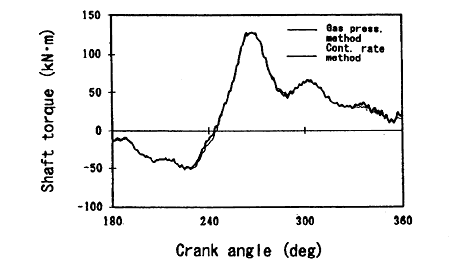
Comparison results between operation management by this contribution rate method and the gas pressure in cylinder method are shown in Fig. 11. And it is confirmed that both of them are in good agreement at each load condition.

Fig. 11-1 Comparison at 25% load

Fig. 11-2 Comparison at 50% load

Fig. 11-3 Comparison at 75% load

Fig. 11-4 Comparison at 100% load
3. 6 Operation analysis and results of diagnosis for the blocked nozzle holes of fuel valve.
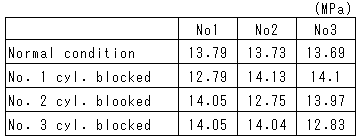
In Table 1, the gas pressure data in cylinder under 100% load operation with the 2 holes blocked nozzle tip are shown.
Table 1 Max. gas pressure under 100% load operation

3. 6. 1 Torque analysis results by the contribution rate method.
In Fig. 12, torque analysis results by the contribution rate method under 100% load operation with the 2 holes blocked nozzle tip are shown. In torque analysis results, it is confirmed that the change of gas pressure in cylinder are clearly caught.
BACK CONTENTS NEXT