Fig. 7. Bond graph model with two accumulators.


Fig. 8. Bond graph model with one accumulator.
6. SIMULATION EXAMPLES
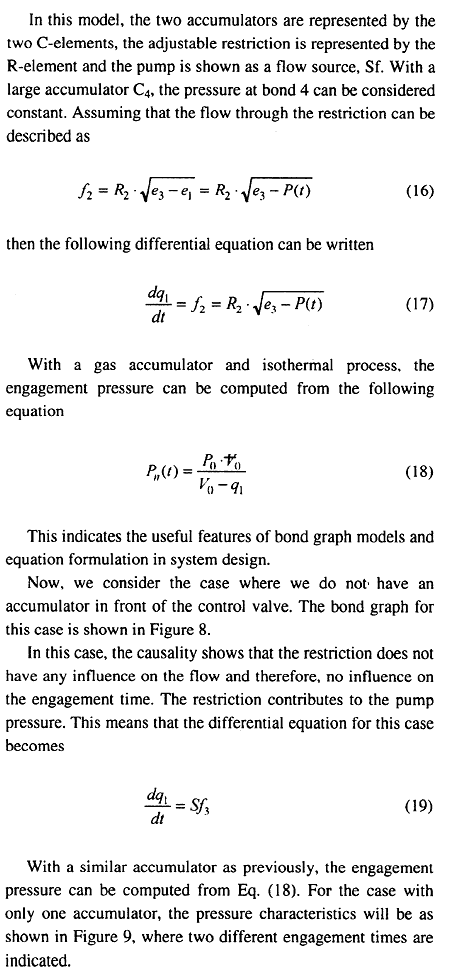
The two different actuating pressure-time histories shown in Figure 9 are applied to the system model shown in Figure 1.
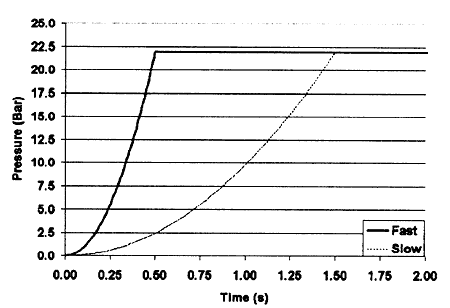
The transient torque in the main coupling is shown in Figure 10.
In Figure 11 is shown the rotational speed of the driven and driving end of the clutch. The driven part picks up speed as it should and becomes equal to the driving speed. The fall in driving speed is due to the proportional speed controller used in this example.

Fig. 9. Actuating pressure.

Fig. 10. Torque in main coupling.

Fig. 11. Rotating speed of driving and driven system.
BACK CONTENTS NEXT