However, a rather higher voltage value was measured in finished cells at almost current density ranges than an unfinished cell of 100兪m in thickness (i.e., unfinished cell of the same thickness) and, therefore, the maximum power density of as high as 1 w/cm2 or higher was given. It can be found that the range of current density capable of generating power is also increased to approx. 3.0 A/cm2 or wider.
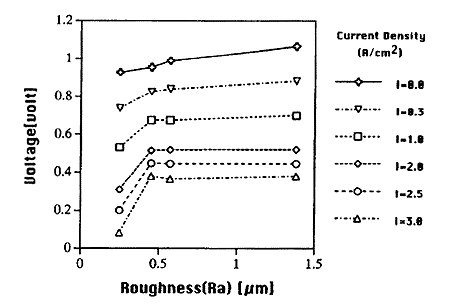
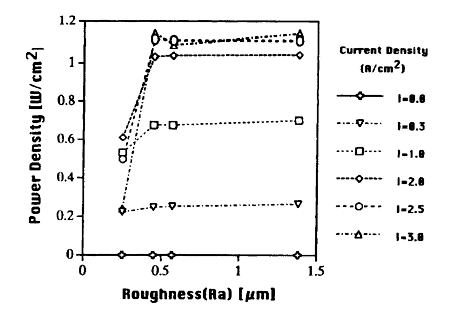
Variations in voltage and power density against the surface roughness of electrolyte are shown in Figs. 6 and 7, respectively. The parameter in both figures is current density. As for the effects of the surface roughness on voltage value, as the roughness increases, the voltage value at the same current density first increases remarkably, but it tends to approach gradually to a constant value when the surface is finished at a roughness of approx. 0.5兪m or higher. The trend of increase of voltage value stated above is particularly remarkable in the ranges where current density is high, and the effects of rough finishing are characterized by the contribution to largely increase cell power generating performance in high current density ranges. The effects on the output density show also approximately the same trend. In Fig,. 5, however, the W-I curve is higher at the center and lower before and after it and, therefore, in Fig. 7, the line graphs are crossed in small roughness areas.
To conclude, though the rough finishing of the surfaces of electrolyte obviously increases the power generating performance of the cell, in the roughness within a specified limit or higher, its effects become approximately a constant. As a result, in actual, a proper roughness must be selected with the mechanical strength of the cell taken into account.
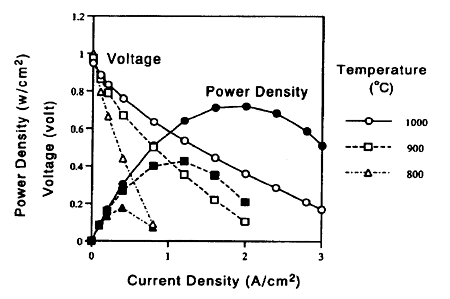
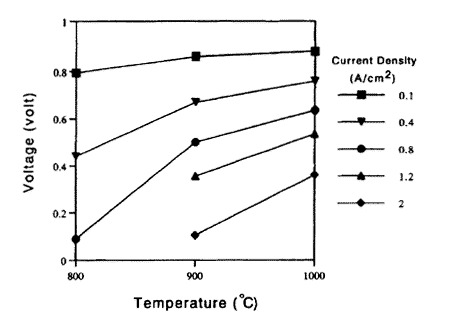
Figure 8 shows the power generation characteristics at the working temperatures of 800, 900, and 1000亷. As expected easily, as the temperature lowers, the voltage generated tends to lower. Also, according to the results in Fig. 9 showing a variation in voltage generation against each temperature, it can be found that the gradient of power generation between 900 and 1000亷 is rather moderate, whereas that between 800 and 900亷 is larger.
丂
Fig. 6丂Variation in Voltage according to Electrolyte Roughness
Fig. 7丂Variation in Power Density according to Electrolyte Roughness
Fig. 8丂Power Generation Characteristics of Cell at Each Working Temperature
Fig. 9丂Voltage according to Working Temperature