Scenario2 in TAB.2 and FIG.3 Shows the number of workers at the time of
docking and the effect of making time in dock shorter.
By transferring maintenance and repair activities to OBM, activities at
the rush hour of docking will be effectively removed. Thus, it is possible to reduce more
time in dry dock. Total number of dry dock activities except for engine division is 147,
whereas there are 16 activities which can be transferred to 0BM. Then, those activities
were excluded as vayage repairs at the time of docking, and cost performance was again
measured by making the time in dock shorter. As a result, the time in dock became 183
hours, with 205 dock workers when activities on CP is all slow moving works. If those
activities are switched to 'fast moving' activities, the time in dock will be 110 hours,
with 255 workers. Th status is shown in Senario 3 inFIG.4.
TAB. 2 shows that the required working force which corresponds to the
same activity hours in order to compare 3 Scenarios. If 0BM activity was strengthened,
docking activity (Scenario 1) which required 186 hours with 235 workers became an
identical activity of 116 hours with roughly same number of workers. It became 116 hours
with 254 workers in dry dock even in Scenario 2. A machine, equipment, technicians,
workers of the repair shop need to be assigned to individual activity.
TAB.2
Time in Dry Dock (in hours)
vs. number of workers
time in dock
Scenario1
Scenario2
Scenario3
HRS
persons
persons
persons
116
293
254
238
126
264
247
228
136
254
241
221
146
248
238
216
156
243
235
212
166
240
235
209
176
237
235
207
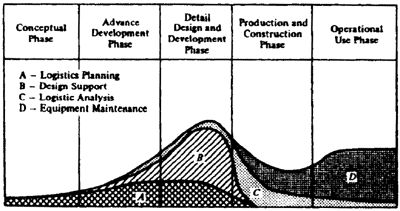
FIG.5 Typical curve of logistics work loads (Blanchard, 1978)
3. AN ANALYSIS OF SERVICE PERSONNEL REQUIRED
In previous chapter we discussed the importance of maintenance program,
especially on board maintenance. Ship's captain want to have more service personnel, while
management of the steamship company wants to decrease ship's operating cost. Here, the
discrepancy occurs between management and ship masters. In order to lead the problem to a
solution, we analyzed ship's record of failures to survey maintenance workloads.
The objective of the analysis is quantitative evaluation of failure
rate and repair rate. The data are indispensable for the simulation research of Operation
and maintenance mode for ship type. Constructing a simulation model requires a lot of data
such as failure rate and repair rate. In place of conventional failure rate (MTBF), one of
the authors, Hashimoto has proposed an integrated criterion to evaluate machinery
reliability (Hashimoto, 1979).
Three indices are failure incidence, average maintenance man-hour, and
crew utilization. Failure incidence λ (events/1000 hours) expresses events/(1000 hours of
operation) and is equal to the reciprocal of MTBF. Here, operating hour is the sum of time
at sea and time in port. Average maintenance man-hour mh (MH/event) is the total
maintenance man-hours plus the total operating hours devided by the number of events. In
other words, it is the average maintenance man-hour per event. Crew utilization, MI
(MH/1000hrs) is