OTC 13302
Surface Roughness Effects on Vortex-Induced Vibration of Cylindrical Structures at Critical and Supercritical Reynolds Numbers
D.W. Allen and D.L. Henning/Shell Global Solutions U.S.
Copyright 2001, Offshore Technology Conference
This paper was prepared for presentation at the 2001 Offshore Technology Conference held in Houston, Texas, 30 April-3 May 2001.
This paper was selected for presentation by the OTC Program Committee following review of information contained in an abstract submitted by the author(s). Contents of the paper, as presented, have not been reviewed by the Offshore Technology Conference and are subject to correction by the author(s). The material, as presented, does not necessarily reflect any position of the Offshore Technology Conference or its officers. Electronic reproduction, distribution, or storage of any part of this paper for commercial purposes without the written consent of the Offshore Technology Conference is prohibited. Permission to reproduce in print is restricted to an abstract of not more than 300 words; illustrations may not be copied. The abstract must contain conspicuous acknowledgment of where and by whom the paper was presented.
Abstract
Experiments examining the effect of surface roughness on vortex-induced vibration (VIV) and drag of flexible cylinders at critical and supercritical Reynolds numbers have been conducted. Four levels of surface roughness were tested for their effect on VIV and drag of a circular cylinder that was 20 diameters upstream of a downstream cylinder (i.e. effectively an isolated cylinder). The rougher cylinders experienced vibrations of up to 3rd mode (in transverse bending). A surprising discovery was that the smooth cylinder experienced low drag and virtually no VIV as the boundary layers became turbulent in the critical Reynolds number range.
Introduction and Background
The study of flow separation and vortex shedding past a circular (or approximately circular) cylinder has a long history. Simple observation of flow past a vertical stick or reed in a stream indicates that man has probably observed this phenomenon well before recorded history. Similarly, vortex-induced vibration (VIV), which results when something free to move experiences vortex shedding, has an equally long history. The vibration felt when attempting to move one's arm through the water as fast as possible is evidence that VIV was also observed in antiquity.
A parameter that strongly influences flow past a circular cylinder is the Reynolds number (Re), which represents the ratio of the convective forces to the diffusive forces, defined as Re=V*D/v. Another important parameter, for the purposes of this paper, is the surface roughness k/D, where k is the average "peak to trough" height of the surface protrusions.
Figure 1 illustrates the basics of flow past a circular cylinder. As the fluid approaches the cylinder, a thin boundary layer (exaggerated in the figure for illustration purposes) forms on each side of the cylinder (shown on only one side). The fluid closest to the cylinder wall is impeded by friction on the cylinder's surface, hence the region between the wall and where the velocity is close to that of the free stream is known as the boundary layer. As the boundary layer fluid proceeds around the cylinder surface, the retardation of the fluid near the surface eventually causes it to come to a halt, thereby resulting in separation of the boundary layer into a"shear layer". Because the outer fluid in the shear layer is moving faster than the inner fluid of the shear layer, the layer rolls up into a vortex. For Reynolds numbers larger than about 40, the vortex pattern is unstable, and thus there is an alternating vortex street that is shed from the cylinder.
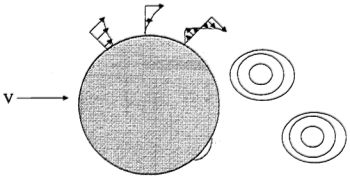
Figure 1: Boundary Layer Formation and Vortex Shedding from a Circular Cylinder
Numerous studies have been made of flow past a stationary circular cylinder, most of these with air as the flowing fluid1-6. These studies have covered Reynolds numbers well exceeding 1x10⁷. Figure 2 illustrates the general relationship that these studies have found between drag coefficient (defined as Cd =Fd/(0.5*p*V2*D*L) and Reynolds number for flow past a stationary cylinder. This figure shows that, at a Reynolds number of about 1x10⁵ (the "critical" Reynolds number range), the drag coefficient diminishes dramatically, a phenomenon known as the "drag crisis". This corresponds to a change in the boundary layers from laminar to turbulent. Since turbulent boundary layers produce flow reattachment (after separation) much more easily than laminar boundary layers, the pressure on the downstream side of the cylinder is reduced. For rough cylinders, the drag crisis is much less pronounced. With sufficient roughness the drag crisis can be eliminated.
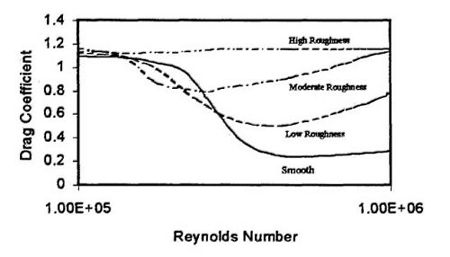
Figure 2: Relative Effects of Roughness on Drag Coefficient for a Stationary Circular Cylinder as a Function of Reynolds Number
Vortex shedding from a circular cylinder produces alternating forces on the cylinder surface. If the cylinder is free to move, then these forces will produce cylinder vibration. If the cylinder vibrates at, or near, one of its structural natural frequencies, then the vibration is initially limited only by the cylinder damping. However, once the amplitude reaches about 1 to 1.5 times the cylinder diameter, the boundary layers are altered enough by the cylinder motion that the vibration becomes self-limiting. If the cylinder does not vibrate at, or near, one of its structural natural frequencies, then the vibration is a forced vibration, and is typically limited to about 0.1-0.2 times the cylinder outside diameter. This is because the lift forces are not sufficient to produce larger motions than this.
The effect of the drag crisis on VIV has been poorly understood. While there has been conjecture as to the possibility of reduced VIV during the drag crisis range of Reynolds numbers, all relevant experiments up until the subject experiments have shown no real change in VIV as the critical Reynolds number range is entered, regardless of the surface roughness. This includes experiments by the authors, who have performed perhaps a large number of such experiments (e.g., see Allen and Henning7).
In 1997 the authors performed experiments on tandem and offset cylinders at critical and supercritical Reynolds numbers in flows with mild shear. The cylinders were approximately 2.5 inches in diameter and over 17 ft long. During testing, it was observed that surface roughness plays a very important role, not just in the drag coefficient, but in the VIV response as well. It was during these tests that the authors made the startling discovery that, if the cylinder's surface roughness is sufficiently smooth, the VIV all but disappears and the drag coefficients are very low. This paper describes results for an upstream cylinder spaced sufficiently from the downstream cylinder (20 times the cylinder diameter) for the upstream cylinder to behave identically to an isolated cylinder. While many subsequent experiments have also supported the results presented herein for uniform flows (many additional sheared flow tests have also supported these discoveries), only the sheared flow results are presented in this paper due to space limitations.
Model Basin
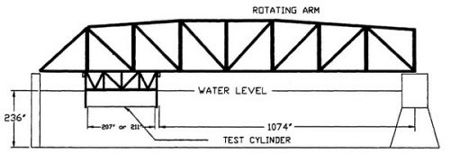
The experiments were conducted in the Rotating Arm Facility at the Naval Surface Warfare Center in Carderock, Maryland. Figure 3 shows the test set-up for these experiments. The Rotating Arm facility is a circular indoor basin approximately 260 ft in diameter and 20 ft deep. Models are towed in circular paths through still water by a rotating arm. The arm is a truss structure with a span of 129 ft, a width of 20 ft, and a weight of 44,000 lbs. The arm pivots on a pedestal in the center of the basin. A maximum arm speed of 30 knots can be achieved in one-half of a revolution at a radius of 120 ft. Speeds of up to 50 knots can be achieved, at the same radius, in about two revolutions. Around the periphery of the basin is a 15-degree slope wave absorber consisting of two layers of permeable bar type concrete resting on an impermeable shelf. An impermeable beach with a 15-degree slope is located around the center pedestal.
Figure 3: Rotating Arm with Test Cylinder, Truss, Struts, and Beams
Test Set-Up
In order to mount the test cylinders to the rotating arm, a pair of struts and a truss were each constructed and assembled. The truss could pivot about pins in the struts to facilitate model change outs. When in the water, the test cylinders were 42.25 inches below the water surface (approximately 17 times the outside diameter). While this truss was made to hold models for tandem and offset cylinder tests, only results from the upstream cylinder (with a spacing between the cylinders of 20 diameters) are reported herein.
The struts were mounted between beams at 89.5 and 109.5 ft from the pivot point of the rotating arm. This produced only a mild sheared flow relative to the cylinder due to the arm motion around the basin.
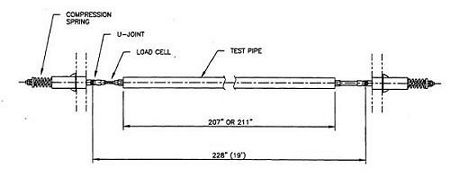
Figure 4 shows the test set-up in more detail. At the end of each test cylinder, a sleeve was mounted, on the outer side of the strut, which housed a compression spring of either 400 lb/inch or 800 lb/inch. The spring was mounted on a rod that extended through the struts toward the pipe, and on the pipe end the threads were stripped and strain gages were welded in place to constitute the drag load cells. Pins were used between the drag load cell and a tension load cell to provide rotational capability (a place holder was used instead of a tension load cell at the outer end), and at each end another pin was used to connect the load cell to the end of a cable which ran through the inside of the pipe. The cable had both 2-inch outside diameter (D, or o.d.) foam and 2-inch o.d. high-density polyethylene spacers, with approximately four foam spacers for every polyethylene spacer. The cable also held the aluminum accelerometer holder in place.
Figure 4: Details of Test Pipe Set-Up
The test pipes were 211.5 inches long except for some of the rougher pipes, which were cut to 207.5 inches long to reduce fatigue failure of the accelerometer leads. The distance between the outer pins was 19.0 ft for all tests.
The test cylinders were fiberglass composite pipes custom made with an outside diameter of approximately 2.5 inches. All of the pipes, except the rough #1 pipes, were ground to a smooth finish and an outside diameter of 2.49 +/-0.01 inches. The fiber angles and layer thickness were chosen so that the pipe joints had an apparent axial modulus of about 2.2x10⁶ psi in tension and an apparent axial modulus of 2.0x10⁶ psi in bending. The following are some of the important weights (in air) for the structures used in these tests:
・Smooth Pipe Weight = 23.13 lb
・Rough #1 Pipe Weight = 24.60 lb
・Rough #2 Pipe Weight = 23.80 lb
・Rough #3 Pipe Weight = 25.02 lb
・Tension Load Cell = 2.55 lb
・Dummy Tension Load Cell = 2.40 lb
・Cable Weight with Aluminum Ends plus Accelerometer Holder = 13.0 lb
・Cable Weight Alone= 12.0 lb
・Total Weight of Cable with Ends, Holders, Spacers, etc. (everything but test pipe) = 19 lb
Four different surface roughness levels were tested. These were: a) smooth pipes which were obtained by grinding the outside diameter; b) rough pipes that consisted simply of the pipes just after they were delivered by the fiberglass manufacturer (these are filament wound pipes) and were designated "rough #1"; c) rough pipes that were prepared by grinding the outside diameter and then gluing small ceramic macro-spheres to the surface (called "rough #2"); and d) rough pipes similar to those called "rough #2" but having larger macro-spheres glued to their surface (called "rough #3"). Below are the measured surface roughness levels for the various surfaces tested. These roughness levels were determined either by confocal image scanning (using a confocal laser microscope) or by combined use of the microscope and a hemispherical model of the roughness (used for the small and large macro-spheres).
・Smooth Pipe: k=1.272x10-4 => k/D=5.09x10-5
・Rough #1 Pipe: k=4.846x10-4 => k/D=1.939x10-4
・Rough #2 Pipe: k=6.233x10-3 => k/D=2.493x10-3
・Rough #3 Pipe: k=1.455x10-2 => k/D=5.820x10-3
Confocal scanning provides an excellent way to determine surface roughness when the surface roughness is relatively homogeneous and the individual roughness elements (whether they be macro-spheres, scratches, etc.) are within the range of the microscope sample. In this case the microscope used one square centimeter samples. Since the largest macro spheres used in these tests (for the rough #3 pipe) ranged from 0.06 in. to 0.11 in. in diameter, a sufficient number of spheres were part of each sample. However, the reader should also note that the scanner performs an integration of the roughness over the sample area. This means that the k/D values reported here might be quite different than those that would have been reported had the roughness been measured by other means. The k/D values from the scanner are typically much smaller due to the averaging in of parts of the surface that do not have roughness elements on them. This is actually quite an advantage though, since this averaging technique allows the scanner to include the effects of the density of the roughness elements.
Natural frequencies were computed for a case with a tension of 2042 lb. The natural frequencies for the first four transverse bending modes were 3.38 Hz, 8.05 Hz, 13.93 Hz, and 20.81 Hz. These tests were designed for 3rd mode(bending) transverse VIV to be experienced by the upstream cylinder when the Reynolds number exceeded about 2.5x10⁵. This information is provided for the reader who might like to attempt to simulate these results using predictive models.