Riser Simulation Programs and Experimental Arrangements
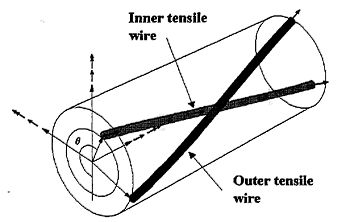
The accuracy of the riser stress analysis program has previously been evaluated by comparing the fatigue performance in destructive tests with simulations. The programme has been optimised from inputs based on strain gauge measurements on the outer tensile armouring. The FBG sensors represents an unique possibility to directly compare the simulated stress levels with measurements for the inner tensile armour layer where the stresses are expected to be largest. No other technology has made such an evaluation possible. The experimental arrangements have been defined to verify the simulation models.
Simulation Model.
The BFLEX stress analysis model is based on the finite element approach, applying a sandwich beam formulation considering each individual wire in the tensile armour layer. Each wire is formulated by a tailor-made truss element, which is assumed to interact with a central core of the pipe by a shear-interaction spring formulation. The spring properties are prescribed in such a way that when the shear stress exceeds the contact pressure times friction coefficient, slip between the wire and the central core occurs. In order to allow the pipe to behave elastic until slip occurs an elasto-plastic material model with isotropic hardening is applied for the shear interaction spring.
In order to enable easy modelling of an arbitrary length of the riser including end terminations, the different elements are assembled into an element structure for each pipe segment, as seen in Figure 6.
In many cases, the fatigue performance is governed by high cycle fatigue at low dynamic curvature levels. The governing parameter with respect to accurately predicting the stresses in such cases is the elastic stiffness of the pipe before slip occurs. This is controlled by the shear interaction diagram given as input to the model, describing at which shear stress slip between layers occurs. Hence, an important contribution from the present work is the possibility of calibrating this diagram to give a best fit in terms of stresses for arbitrary curvature levels.
Fig.6-BFLEX Element Structure.
Experimental Arrangements.
To evaluate and eventually update the simulation model, a minimum of accuracy and spatial resolution is required. A specification of the operational requirements and the optimum positions of the strain sensors in the test riser were worked out. This was governed by the use of a bellmouth to give a well-defined pipe curvature. After the strain measurement testing, a destructive test was to be carried out with the aim of obtaining fatigue after 400 000 cycles during a 3 months period.
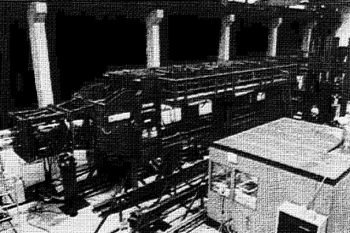
Due to schedule restraint and limitations in the test rig, the bellmouth had to be designed to give sufficient curvature at a certain maximum applied end angle. The bellmouth was manufactured in two halves using T-shaped steel profiles. Figure 7 shows the riser test specimen installed in the test rig whereas Figure 8 shows the bellmouth section.
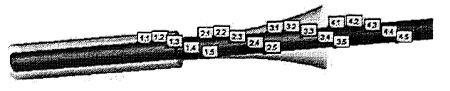
The number of strain sensors was selected considering the pitch of the inner tensile armour, model calibration at both large and small curvature levels and to assess the stress distribution throughout the entire bellmouth curve section towards both ends. It was also important to enable assessment of the two most important stress contribution effects. These are the friction induced axial stress with maximum at the tensile/compressive side of the pipe, and the bending stress due to bending about the wire strong axis with maximum at the neutral axis of the pipe. To meet these requirements, it was decided to cover two pitches with strain sensors at 45 degrees angular intervals. This was obtained by installing 8 sensor tubes, one at each side of four wires. In each sensor tube there were 5 sensors covering one half pitch along the helix. The positions of the strain sensor stations relative to the bellmouth(one sensor tube at each side of the wire) are shown in Figure 9.
The first strain measurement test program was worked out to give sufficient calibration data for both small and large curvatures. The test program included various combinations of internal pressure, external tension and bending angles to define the riser curvature. To achieve strain measurements from a large number of spatial positions the test programme was repeated for three different rotational angels of the test riser.
Fig.7-Test specimen installed in the test rig.
Fig.8-Test spesimen and bellmouth.
Fig.9-Positions of strain sensors.
Testing
Two test programmes were planned for the riser. The objective of the first test programme was to use the results to verify and optimise the riser simulation programme. A destructive test followed the first test programme. To define the test parameters that would generate failure during the 400 000 cycles, the results from the first test programme was used as input.
FBG Measurements.
The read-out unit measures the Bragg wavelength of the sensors. These will reflect changes of temperature and strain depending on the sensor characteristics. All sensors have been calibrated in advance. The measured wavelengths are converted to local strain at both sides of the wires, and the axial and bending strain components can be calculated. A typical test sequence in the first test programme takes only a few minutes. The heating due to friction will be negligible during such test because of the limited energy dissipated and the large thermal capacity of the armouring wires.
Thus there is no need for thermal compensation during the tests. The strain conversion coefficient does not change with temperature.
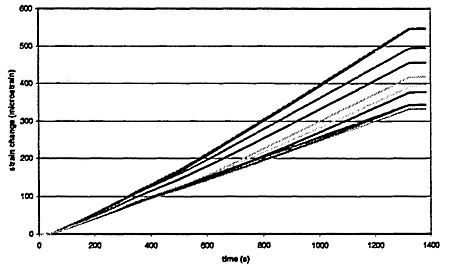
The strain levels in the wires have been monitored both during the bending cycles and also during the change of internal pressure and tension. An example of strain levels as a function of time in one armouring wire when increasing the internal pressure in the riser can be seen in Figure 10. The strain levels are related to the levels when the pressurising starts (only relative).
Fig.10-Measured strain levels in ten sensors in an armouring wire (both sides) when increasing the pressure in the riser.
The measured strain values clearly illustrates that there will be variation along the wires and from one wire to another. The measurements have given detailed information about what happens in the test riser during various load cycles.
All the sensors have been monitored in various situations with fixed loads. In this way the distribution of the static loads can be evaluated along the wires and from one wire to the other. The strain sensors give a "Visual look" of the conditions in the riser at various situations.
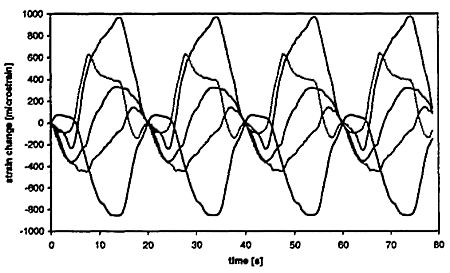
The dynamic tests (bending) are the most important for verification of the simulation model. Large bending angles generate high stress levels and are critical for estimation of lifetime and fatigue damage. An example of the monitored strain levels in one sensor tube can be seen in Figure 11. The strain levels are relative to the levels at the start of the test. The figure shows the strain levels along one side of a wire during four bending cycles. As can be seen from the figure, the repeatability during the cycle is good. The amplitude and shape of the strain curve depends on the position of the strain sensor in the riser.
Fig.11-Strain levels in one sensor tube during bending. Five strain sensors are shown.
Measured and simulated strain levels.
The measured strain levels is converted into stresses and compared with simulated stress levels obtained by BFLEX for all stations and load cases defined in the test specification.
The measured data in terms of strain histories was used to determine for which pipe curvature slip between layers occurred. This was then used to calibrate the shear interaction model. At the time of writing this paper, the stress assessment and model calibration work is not yet completed for all load cases. However, for the load cases processed excellent agreement has been found using reasonable input parameters, and it has certainly been verified that FBG sensor technology is an excellent way to measure the stresses in the tensile armour layer.
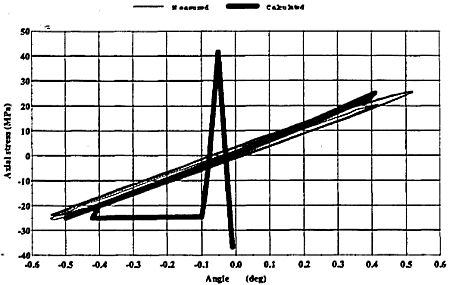
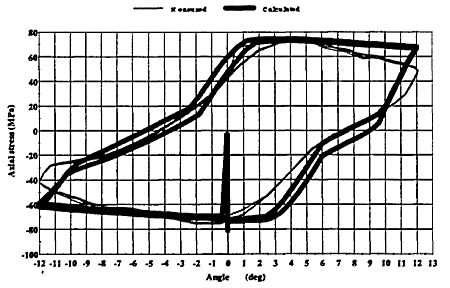
Figures 12 and 13 shows an example comparison between the simulated and measured axial stress history at one location for load cases with small (+/-0.5 deg.) and large (+/- 12 deg.)bending angles, respectively. The internal pressure and the tension are the same in both cases. The peaks in the simulated diagrams are due to the numerical procedure used to obtain the desired initial stress level in terms of internal pressure and tension. It is seen that for small bending angles, there is insignificant hysteresis, indicating that the pipe is in the no-slip elastic regime, whereas for large bending angles significant hysteresis occurs indicating that the wires are in the full slip regime. It is seen that excellent agreement is found between simulations and the measured values for both cases.
Fig.12-Axial stress history for small bending angles.
Fig.13-Axial stress history for large bending angles.
Conclusion
It has been proven feasible that fibre Bragg grating sensors can be integrated in the annulus of flexible risers and can monitor the strain and temperature in the inner tensile armouring. The test results have been used to update and calibrate riser simulation models to improve the predictability for the reliability of present and future designs. In this way FBG sensing technology has been used to increase the safety of flexible risers. In future applications real time monitoring of installed risers can be used to predict remaining lifetime and/or indicate leakage and corrosion, effects with great impact on the reliability and lifetime of flexible riser systems.
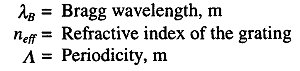
Nomenclature