Instrumentation and Data Acquisition
As mentioned above, drag and tension were measured using load cells. Pipe accelerations were measured using biaxial accelerometers mounted at 1/6th of the length (38 inches) from the inboard end (as measured from the point of rotation at the end of the drag load cell). Prior to testing, the accelerometers were calibrated with a shaker assembly and found to be accurate to within 1.5 percent at 10 Hz (as compared with an LVDT). An accelerometer was also mounted to the rotating arm, which experienced accelerations much less than 1 percent(often around 0.01 percent) than the pipe accelerations.
Tow speed measurements were made by feeding the arm speed measurements (obtained by a magnetic pickup on one of the wheels at the outer edge of the arm) directly into the data acquisition system. The arm speed (radians/sec) was converted to speeds for the test pipe based upon the location of the test pipes along the arm span.
The water temperature was 66 degrees Fahrenheit and was used to determine the kinematic viscosity value of 1.11x10⁻⁵ft2/sec that was used in the Reynolds number computations.
For each series of runs, the tests were generally conducted with increasing arm velocity. For the first speed in each series of runs, the arm was accelerated from rest to the test speed, and then that speed was held for at least 10 seconds (only the last 8 seconds of data was used in the data analysis for each test) and usually about 12 seconds. The arm was then accelerated to the next speed, and when a steady arm speed was obtained, that speed was maintained for at least 10 seconds. The arm was then accelerated a third time to obtain a third speed for the lower speed runs. Thus, the first nine Reynolds numbers tested for each pipe were obtained with three test speeds per run, the next two Reynolds numbers were obtained with two speeds in the run, and then only one speed per run was used for higher Reynolds numbers (only performed for the smooth cylinder). This is because the arm was restricted to one revolution around the tank while obtaining data (the pipe sometimes crossed its wake during deceleration).
Typically the data was preliminarily processed right after each run. This took quite some time, but allowed the water motions to decay prior to the next run. This time was not recorded and was based upon visual observations of the water motions (until the water was relatively calm).
All tests were sampled at 256 Hz. The data analysis included double integration of the accelerations to produce displacements and filtering of the data between a high pass filter setting and a low pass filter setting of 40 Hz. The low pass filter setting varied from test to test, but was generally chosen to be about 1/3rd of the estimated vortex shedding frequency for that test velocity (using a Strouhal number of 0.2 with fs=[V*S]/D).
The mean drag coefficients were computed by assuming the velocity to be linear along the pipe length and using the integration of the velocity squared and the total drag as measured by the load cells at the ends. Thus, the drag coefficients reported represent a lumped valued for the entire test pipe. The velocity at the outer end of the pipe (based upon the arm speed and the pipe location) was used for the Reynolds number calculations.
Test Results
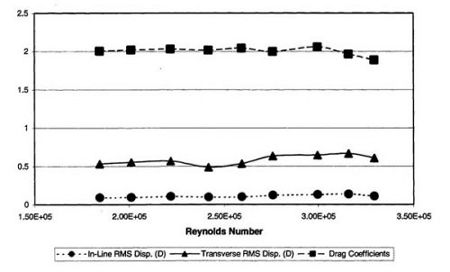
Figures 5-8 present the rms (root mean squared) displacements and drag coefficients for each of the four surface roughness levels tested. Figure 5 shows, at the highest roughness level, there is very little influence of Reynolds number on the results, with the exception of an increase in the displacements at the higher Reynolds numbers. However, it should be noted that the vibration changed from 2nd to 3rd mode just above a Reynolds number of 2.5x10⁵, so that the anti-node of vibration was closer to the accelerometer location for the higher Reynolds numbers (no adjustments have been made for mode shape in these results - the results are strictly from the accelerometer measurements).
Figure 5: Results for Rough #3 Test Cylinder
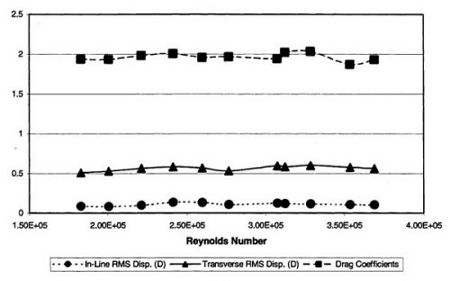
Figure 6 presents results for the 2nd highest roughness level and the results are very similar to those of Figure 5. The reduced roughness level had very little influence over the results, with only a slight decrease in drag coefficient for most of the Reynolds numbers tested. This indicates that, at these roughness levels (k/D=2.493x10-3 and higher), additional surface roughness has little effect on the results (note that this is strictly true for only this type of surface roughness).
Figure 6: Results for Rough #2 Test Cylinder
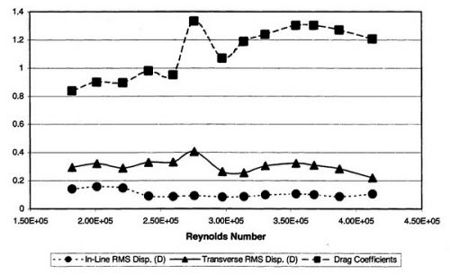
Figure 7 reveals a dramatic difference when the roughness is reduced to k/D=1.939x10-4. The drag coefficients are about 35-55 percent lower than those in Figure 6. The transverse rms displacements are also reduced almost as dramatically, most likely accounting for the majority of the drag force reductions.
Figure 7: Results for Rough #1 Test Cylinder
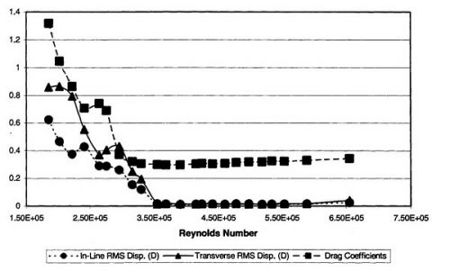
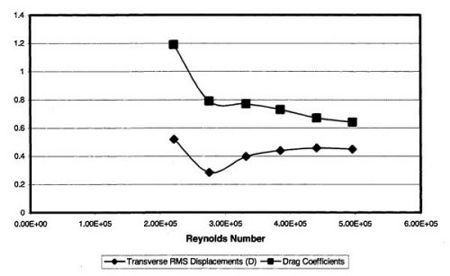
Figure 8 reveals the most dramatic change of all. With a roughness level of k/D=5.09x10-5, the drag crisis eventually results in reductions of the displacements to less than 0.02 diameters (D). The drag coefficients are also reduced to about 0.3; values typical for a stationary smooth cylinder in this Reynolds number range. Note that the transverse displacement at the highest Reynolds number appears to have a small, but significant, increase over that at the next-to-highest Reynolds number. This is caused by small vibration of the entire test rig (due to the test velocity exceeding the design arm speed) and not due to vibration of the cylinder itself (subsequent tests by the authors have revealed that smooth cylinders can virtually eliminate VIV at much higher Reynolds numbers than those that were achieved during these tests).
Figure 8: Results for Smooth Teat Cylinder
Figure 9 is an excellent plot for comparison with Figure 8. It is derived from data previously published by the authors7. This figure is a plot of first (bending) mode VIV of a smooth, ABS (plastic), cylinder experiencing critical Reynolds number, uniform, flow. The results show substantial VIV despite the cylinder having a very low surface roughness. The cylinder was extruded ABS that was handled carefully to minimize abrasions. While the surface roughness of this cylinder was not measured at the time of testing, later surface roughness measurements on similar cylinders indicates that the average peak to trough roughness for this cylinder was about k/D=1.0x10-4. Figure 9 also serves to illustrate that, while the drag coefficient may drop due to low surface roughness, the increased roughness of this cylinder (over that of the cylinder of Figure 8) causes a dramatic change in the displacement (vibration).
Figure 9: Results for ABS Test Cylinder in Uniform Flow (Allen and Henning7)
A very pertinent puzzle is the physics behind the differences between the results of Figure 7 and those of Figure 9. The rough #1 pipe was rougher than that of Figure 9, however the rough #1 pipe had lower displacements, but much higher drag. The higher surface roughness of the rough #1 pipe explains its higher drag but does not explain its lower displacements. Most likely this is due to a combination of: a) the higher mode number experienced by the rough #1 pipe; and b) the different character of the surface roughness between the two pipes.
Variations in damping between the two experiments and the fact that the rough #1 pipe was tested in sheared flow might also have played roles but are less likely to be the primary drivers. The damping is unlikely have had a strong influence on the differences due to the large vibrations experienced by the rough #2 and rough #3 pipes which had the same test setup as the rough #1 pipe. This observation also applies to the sheared flow influence.
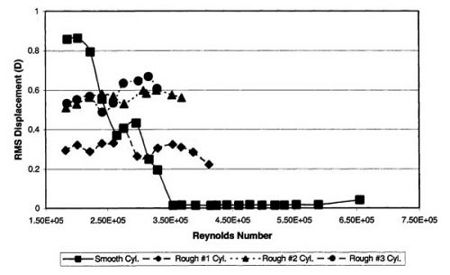
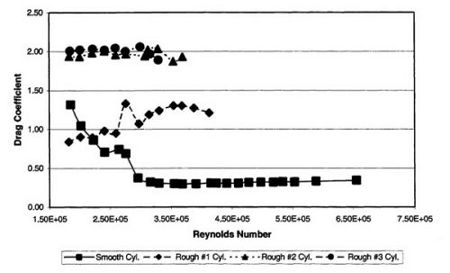
Figure 10 presents the transverse rms displacements for each of the four cylinder roughness levels presented in this paper. Similarly, Figure 11 presents the drag coefficient comparisons. These figures allow the reader to easily observe the relative differences in the results due to surface roughness variations as the Reynolds number is increased.
Figure 10: Comparison of Surface Roughness Effects on Displacement
Figure 11 : Comparison of Surface Roughness Effects on Drag Coefficient
One other area of importance is the vibration response frequencies. Since the response frequencies are not the primary emphasis of this paper, they are not discussed in detail. However, the following should be noted:
1. Except for the smooth cylinder at high Reynolds numbers, the response was usually quite narrow banded with a single peak in the power spectra.
2. This peak increased in frequency as the test velocity (and Reynolds number) increased.
3. The response frequency was often not identical to the natural frequency for the mode excited.
4. The natural frequency increased with increased test velocity due to the increase in axial tension on the test cylinder.
5. The combination of items 3 and 4 above sometimes made it difficult to identify the mode changes.
6. Even at high Reynolds numbers when the vibration was small, the smooth cylinder often exhibited distinct peaks in its power spectra at one or more modes (although they were not nearly as narrow banded as those of the rougher cylinders). Often there was more than one peak in the response, making it difficult to identify whether the excitation source was a higher harmonic or secondary forcing from the vortex shedding.
Conclusions and Ramifications
The results of these experiments represent a breakthrough in our understanding of VIV and drag of circular cylinders at critical and supercritical Reynolds numbers. For the range of Reynolds numbers tested, the results have specifically shown that:
1. VIV of a circular cylinder can be virtually eliminated if the surface is sufficiently smooth.
2. As the surface roughness increases, the displacement also increases. However, for cylinders with roughness of k/D=2.493x10-3 and k/D=5.820x10-3 the rms displacements were approximately the same, indicating that once a cylinder is sufficiently rough, further increase in the surface roughness has little effect on the displacement.
3. The drag coefficient appears to be strongly coupled to displacement, with the smoothest cylinder having the lowest drag. For the type of surface roughness tested, there appears to be only a small increase in drag when the surface roughness is increased beyond k/D=2.493x10-3.
4. Differences between the results of these experiments and previous experiments for moderately low surface roughness indicates that the character of the surface roughness as well as the mode shape may also be important parameters for identifying both the displacements and the drag.
The discovery that VIV of a long slender cylinder can be virtually eliminated at critical and supercritical Reynolds numbers through sufficient smoothness suggests numerous possibilities and applications. Potential applications in the oil and gas industry include: reduced VIV and drag for drilling risers; reduced VIV for production risers and tendons (including installations where marine growth has not yet initiated); and other slender members such as truss members on spars. Outside the oil and gas industry there are many potential applications including industrial chimney stacks, aerospace structural members, large diameter power transmission lines, bridge and tunnel support members, etc . While the practical application of this discovery can certainly be difficult, for large diameter structures the k (dimensional roughness height) in the k/D ratio can be quite reasonable. This has already allowed the practical application of this technology to drilling riser VIV and drag reduction. It is the hope of the authors that this discovery will provide benefits that are limited only by man's ingenuity.
Nomenclature
Cd = drag coefficient
D = outside diameter (in. or ft)
Fd = drag force (lbf)
fs = vortex shedding frequency (Hz)
k = roughness average peak to trough height (in. or ft)
k/D = roughness average peak to trough height ratio
L = length (ft)
Re = Reynolds number
S = Strouhal number
V = current velocity (ft/sec)
v = kinematic viscosity (ft2/sec)
p = fluid density (lbf*sec2/ft4)
Acknowledgements
The authors would first like to thank Shell International Exploration and Production, Inc. for permission to publish this paper. The authors are quite grateful to the many people who contributed to these experiments . K. Him Lo was very helpful in determining the composite pipe properties and assisting with their fabrication. Joe Haws performed the data acquisition set-ups and Doug McMullen performed the final data processing. Greg York conducted the confocal scanning. Keith Bough, formerly of E.G.&G., performed the detailed truss and strut design and oversaw its fabrication and installation. Bill Holt, Steve Ebner, and the many electricians and technicians at the Naval Surface Warfare Center assisted with the testing in a wide variety of ways. The authors have performed many VIV testing programs with the above-mentioned personnel and have always found them all highly competent and a pleasure to work with.
References
1. Achenback, E.(1968), "Distribution of Local Pressure and Skin Friction Around a Circular Cylinder in Cross Flow up to Re = 5x10⁶,"J. Fluid Mech., vol. 34, part 4, pp. 525-539.
2. James, W. D, et al.: (1980), " Study of Viscous Crossflow Effects on Circular Cylinders at High Reynolds Numbers, AIAA Journal, vol. 18, No. 9, pp. 1066-1072.
3. Jones, G. W. et al.: (1969), "Aerodynamic Forces on a Stationary and Oscillating Cylinder at High Reynolds Numbers," NASA TR R-300
4. Roshko, A. (1961), "Experiments on the Flow Past a Circular Cylinder at Very High Reynolds Number," J. Fluid Mech., Vol. 10, pp. 345-356.
5. Schewe, G. (1983), "On the Force Fluctuations Acting on a Circular Cylinder in Crossflow From Subcritical up to Transcritical Reynolds Numbers," J. Fluid Mech., Vol. 133, pp. 265-285.
6. Shih, W. C. L. et al.: (1992), "Experiments on Flow Past Rough Circular Cylinders at Large Reynolds Numbers," 2nd Intl. Colloquim on Bluff Body Aerodynamics and Applications, Melbourne Australia, December 7-10.
7. Allen, D. W. and Henning, D.L. (1997), "Vortex-Induced Vibration Tow Tests of Smooth Cylinders at Supercritical Reynolds Numbers, Proceedings of the 1997 ISOPE Conference, Honolulu.
SI Metric Conversion Factors
| ft x 3.048 |
E - 01 = m |
| in x 2.54 |
E + 00 = cm |
| psi x 6.894 |
E + 00 = kPa |
| lbfx 4.448 |
E + 00 = N |
| °F x 1.8+32 |
E + 00 = ℃ |