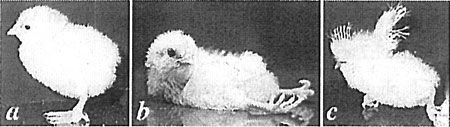
Photographs of the normal chick (a) and the chicks with lesions of a length measuring 5 (b) and 7 somite (c). (photographs courtesy of Dr. K. Mominoki)
Fig2:
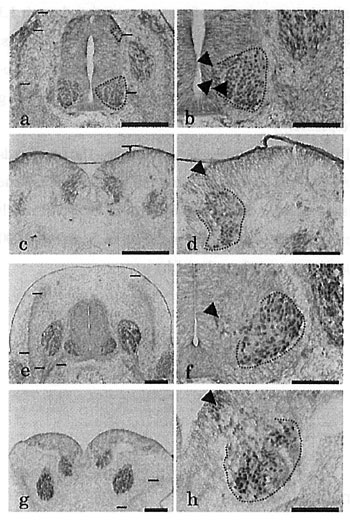
Distribution of Islet-1 positive neurons in neural tube at E4 and E5.
a-d: photomicrographs of transverse section through L3 neural tube in control (a, b) and SBA (c, d) at E4.
e-h: photomicrographs of transverse section through L3 spinal cord in control (e, f) and SBA (g, h) at E5. (Figs. b, d, f and h are the high magnification photomicrographs of left ventral horn in Figs. a, c, e and g respectively.)
Islet-1 is visible in the whole ventral horn and DRG. There is little amount of Islet-1 positive neurons in the dorsal horn and the area around roof plate. The arrows indicate the immature Islet-1 positive neurons migrating from the ependymal layer to the ventral horn.
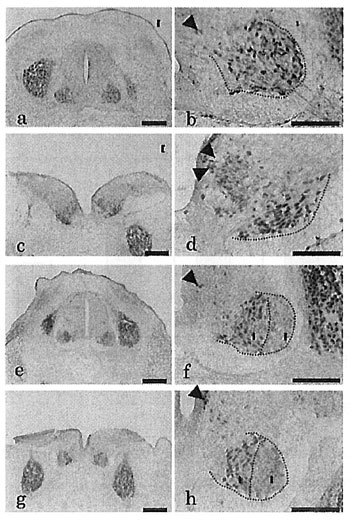
Distribution of Islet-1 positive neurons in ventral horn at E5.5 and E6.
a-d: photomicrographs of transverse section through L3 spinal cord in control (a, b) and SBA (c, d) at E5.5.
e-h: photomicrographs of transverse section through L3 spinal cord in control (e, f) and SBA (g, h) at E6. (Figs. b, d, f and h are the High magnification of photomicrographs of left ventral horn of Figs. a, c, e, and g respectively.)
At E5.5 (a-d), Islet-1 positive neurons exist throughout the ventral horn, but exist only in LMCm at E6 (e-h). The arrows indicate the immature Islet-1 positive neurons migrating from ependymal layer to the ventral horn.
VH=ventral horn; LMCl=lateral part of lateral motor column; LMCm=medial part of lateral motor column.
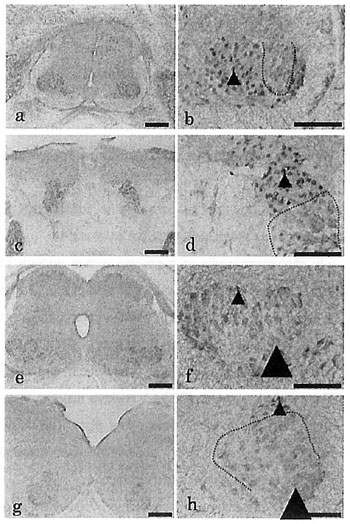
Distribution of Islet-1 positive neurons in ventral horn at E7 and E9.
a-d: photomicrographs of transverse section through L3 spinal cord in control (a, b) and SBA (a, d) group a tE7.
e-h: photomicrographs of transverse section through L3 spinal cord in control (e, f) and SBA (g, h) at E9. (Figs. b, d, f and h are the high magnification of photomicrographs of left ventral horn of Figs. a, c, e, and g respectively.)
The arrows indicate Islet-1 positive nuclei. The arrowheads in Figs. f and h shows the Islet-1 positive cytoplasm. Some Islet-1 positive ells inside the lines in Figs. b, d and h present weak Islet-1 signals in the nuclei Scale bars =200μm (a, c, e, g), 100μm (b, d, f, h)
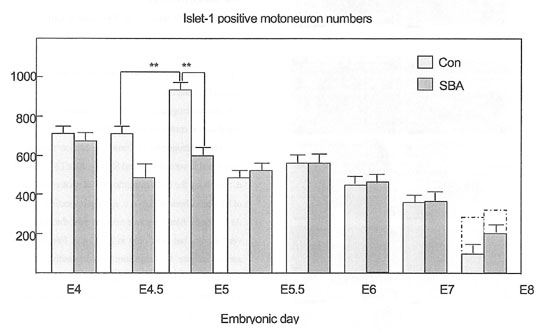
Fig.5:
Chronological changes in the number of Islet-1 positive neurons in L3 ventral horn from E4 to E9 of control (gray) and SBA (black). **P<0.01: significantly different from the former stage and the control of the same stage.