|
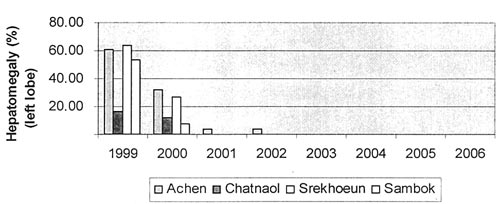
Figure 1.
|
Clinical symptom (Hepatomegaly) of Schistosomiasis of school children in sentinel villages in Kratie between 1995 and 2006
|
Hepatomegaly of children in Sentinel villages
(Kratie province)
|
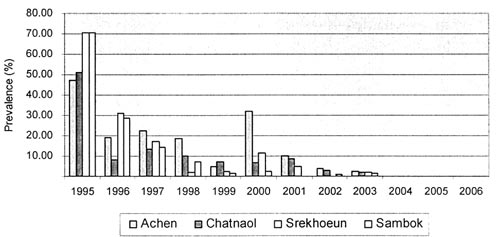
Figure 2.
|
Prevalence of schistosomiasis in Kratie between 1995 and 2006
|
|
Impact of control on schistosomiasis prevalence in four Sentinel villages in Kratie
|
|
Table 1.
|
Parasite prevalence of school children in Kratie Province, January 2006
|
| Village |
# |
Male
(%) |
Female
(%) |
S.mekongi % |
A. lumbri
(%) |
T. trichiura |
Hookworms
(%) |
| Achen |
130 |
70(53.8) |
60(46.2) |
0 |
0 |
0 |
20(15.4) |
| Ampiltuk |
88 |
42(47.7) |
46(52.3) |
0 |
0 |
0 |
35(39.8) |
| Chartnol |
146 |
66(45.2) |
80(54.8) |
0 |
0 |
0 |
33(22.6) |
| Kampi |
65 |
32(49.2) |
33(50.8) |
0 |
0 |
0 |
13(20.5) |
| Kbal Chour |
124 |
74(59.7) |
50(40.3) |
0 |
0 |
0 |
27(28.7) |
| Kg. Krabei |
116 |
48(41.8) |
68(58.2) |
0 |
1(0.8) |
1(0.8) |
31(29.3) |
| Kheang Brasat |
90 |
48(53.3) |
42(46.7) |
0 |
0 |
0 |
12(13.3) |
| Koh Pdoa |
130 |
76(58.5) |
54(41.5) |
0 |
0 |
0 |
52(40.0) |
| Phum Thom |
150 |
89(59.3) |
61(40.7) |
0 |
0 |
0 |
17(11.3) |
| Samphin |
137 |
69(50.4) |
68(49.6) |
0 |
0 |
0 |
21(15.3) |
| Sambo |
136 |
73(53.7) |
63(46.3) |
0 |
0 |
0 |
32(23.5) |
| Sambok |
150 |
85(57.0) |
65(43.0) |
0 |
0 |
0 |
36(24.0) |
| Samrong/Kakot |
94 |
56(59.6) |
38(40.4) |
0 |
0 |
0 |
27(28.7) |
| Sandan |
154 |
80(51.9) |
74(48.1) |
0 |
0 |
0 |
48(31.2) |
| Srekhoeun |
100 |
54(54.0) |
46(46.0) |
0 |
0 |
0 |
9(9.0) |
| Tonsong Tleak |
120 |
64(53.3) |
56(46.7) |
0 |
0 |
0 |
29(24.2) |
| Talous |
145 |
71(49.0) |
74(51.0) |
0 |
1(0.7) |
0 |
30(20.7) |
| Thmar Kre |
142 |
68(45.8) |
74(54.2) |
0 |
0 |
0 |
29(20.4) |
| Vattanak |
113 |
55(48.7) |
58(51.3) |
0 |
0 |
0 |
25(22.1) |
|
| Three consecutive stool samples were examined in 4 sentinel villages Char Tnol, Sambok, Sre Koeun, Achen. |
|
Table 2.
|
Parasite prevalence of school children in Stung Treng Province, February 2006
|
| Village |
# |
Male
(%) |
Female
(%) |
S. mekongi |
A. lumbri
(%) |
T. trichiura
(%) |
Hookworm
(%) |
| Sdau |
95 |
46(48.4) |
49(54.6) |
0 |
0 |
0 |
27(28.4) |
| Phum Krom |
110 |
48(43.6) |
62(56.4) |
0 |
0 |
0 |
26(23.6) |
| O. Svay |
110 |
66(60.0) |
44(40.0) |
0 |
1(0.9) |
0 |
26(23.6) |
| Koh Sneng |
110 |
36(32.7) |
74(67.3) |
0 |
0 |
0 |
21(19.0) |
| Kaing Cham |
110 |
71(64.5) |
39(35.5) |
0 |
0 |
0 |
52(47.3) |
| Pchol |
99 |
39(29.3) |
60(70.7) |
0 |
0 |
1(1.0) |
26(26.3) |
| Koh Preah |
110 |
57(51.8) |
53(48.2) |
0 |
3(2.7) |
2(1.8) |
16(14.5) |
| Plouk |
111 |
52(46.8) |
59(53.2) |
0 |
0 |
0 |
37(33.3) |
| O. Lang |
110 |
50(45.5) |
60(54.5) |
0 |
3(2.7) |
1(0.9) |
30(27.3) |
| Anlong Svay |
110 |
60(54.5) |
50(45.5) |
0 |
5(4.5) |
0 |
18(16.4) |
| Sre Tapann |
99 |
57(57.6) |
42(42.4) |
0 |
2(2.0) |
0 |
24(24.2) |
| Siem Pang |
112 |
63(56.3) |
49(43.7) |
0 |
7(6.3) |
3(2.6) |
19(16.9) |
| Keth Moeung |
86 |
52(60.5) |
34(39.5) |
0 |
1(1.2) |
0 |
21(24.4) |
|
| Three consecutive stool samples were examined in Sdau and Kaing Cham. |
|