|
5. COMPARISON BETWEEN MEASURED AND SIMULATED RESULTS
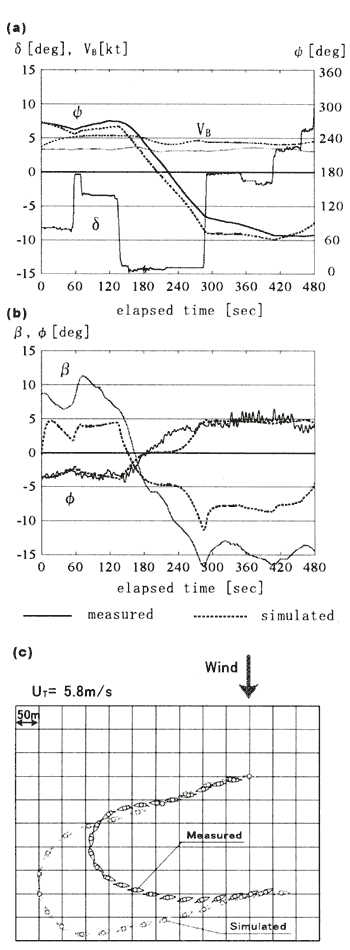
The Runge-Kutta Method was employed to calculate the equations of motion. Input data for the simulation is the measured time history of rudder angle at every 0.1 seconds. Figure 10 and 11 show the comparison between measured and simulated results during 480 seconds for the wearing operation from different tacks. In the figures, (a) shows time histories of rudder angle δ, heading angle Ψ and ship velocity VB: (b) shows those of heel angle ψ and leeway angle β; (c) shows ship trajectories at every 20 seconds. In the figure (c), wind blows from upper side of the figure and the grid spacing is 50 meters. For the illustration of small ship symbol, the heading angle coincides with Ψ, but the rudder angle is emphasized in three times of δ
In Figure 10, true wind velocity is 5.8m/s, and wearing operation starts from starboard tack and rudder is steered from -3 degrees to -14 degrees, which is almost maximum rudder angle from the limitation of rudder support structure. The heading angle changes from 270 degrees (-90 degrees from wind direction) to 70 degrees through 180 degrees (running condition). In Figure 11 , on the other hand, true wind velocity is 7.3m/s and wearing operation starts from port tack and rudder is steered from 3 degrees to 9 degrees. The heading angle changes from 70 degrees to 280 degrees (-80 degrees from wind direction). In both cases, the simulated velocities are higher than the measured velocities. The differences were caused by the difference of sail force coefficients between measured and simulated. The sail force coefficients used for the simulation were obtained from the maximum thrust condition of the wind tunnel test. However, during the sea trial, our sail trimming skill was not sufficient to obtain the best sail performance. This difference between measured and simulated velocities also appeared in the polar diagram indicated in the reference [1], in particular at abeam and broad reach wind conditions.
Figure 10 is an example of a significant steering operation, but poor sail trimming. At first we trimmed the sail too tightly for the abeam wind condition. Therefore, the measured ship velocity V is considerably lower than the simulated velocity shown in Figure 10(a), and also the measured leeway angle is large as shown in Figure 10(b). After the wearing operation, we again trimmed the sail too tightly, and so the leeway angle became -15 degrees. The low velocity is another reason for the large leeway angle. In Figure 10(a), the ship heads to 180 degrees (Ψ=180 deg., i.e. running condition) at 220 seconds . We can see the roll angle ψ already changes to the new tack at this moment in Figure 10(b). This means the jibing operation of the sail was performed smoothly in advance. In the simulation, sail performance is calculated using the best sail coefficients for the each wind direction. Hence the ship maintains its high velocity resulting in a small leeway angle before wearing operation. However, it can be seen that the simulated leeway angle in Figure 10(b) clearly shows the feature of angle variation, which was caused by steering operation, appeared in the measured data. The simulated turning radius of trajectory also coincides well with the measured one in Figure 10(c).
Fig. 10 |
Comparison between measured and simulated results at wearing maneuver (starboard tack to port tack) |
Fig. 11 |
Comparison between measured and simulated results at wearing maneuver (port tack to starboard tack) |
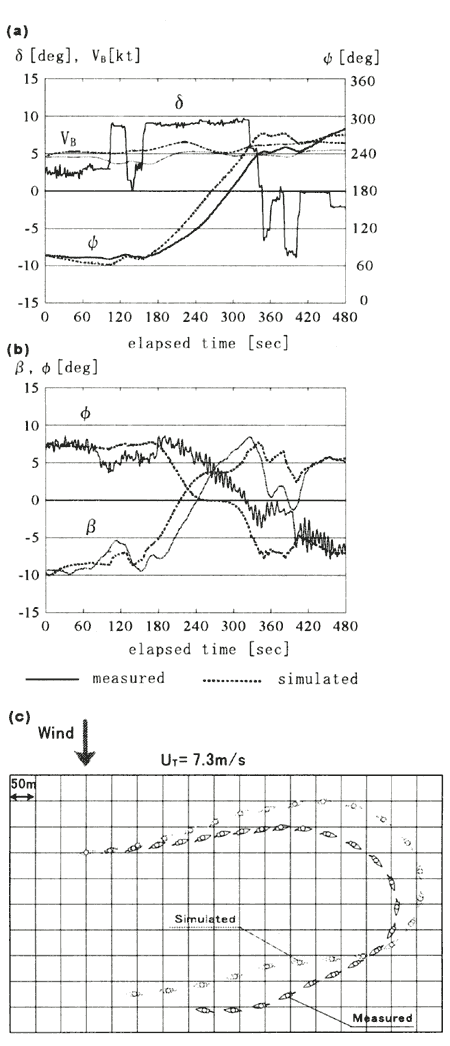
Figure 11 is an example of a small steering operation with fairly good sail trim. However, we had difficulty with sail trim during this wearing operation due to strong wind. At first the sail trim was good, but the difficulty occurred at 13O seconds. At 80 seconds, we started to ease sail sheets for the preparation wearing operation, and the rudder was steered from 100 seconds. These events caused a decrease of both roll and leeway angles as shown in Figure 11(b), Unfortunately, the steering operation stopped at 130 seconds due to the sail sheeting trouble on the deck. The rudder turned back to around O degree and steered again to 9 degrees at 160 seconds. During this period, from 80 seconds to 160 seconds, we did not trim the sail to adjust the wind. This mismatch of sail and wind resulted in a decrease of the ship velocity and losing distance to windward as shown in Figure 11(a) and (c). On the other hand in the simulation there is no mismatch of sail and wind, and then the simulated results show good performance without reduced speed or losing distance to windward. The high velocity in the simulation also causes a quicker change of heading angle than the measured one as shown in Figure 11 (a). In the measured data, the ship heads to 180 degrees (Ψ=180deg.) at 300 seconds in Figure 11 (a). In this case, we can see the roll angle ψstill remains in the state of former tack at this moment in Figure 11(b). This indicates a delay of jibing operation of the sail. The jibing operation was performed from 340seconds to 400seconds. We can see both roll and leeway angles decrease significantly at this moment in Figure 11(b). This delay of jibing causes a loss of distance to windward as shown in the latter part of the measured trajectory in Figure 11 (c). However, in this case the simulated ship trajectory shows fairly good agreement with the measured one.
The simulation also well shows the difference of turning radiuses due to different steering angles of both cases in Figure 10(c) and 11(c). From these results, it can be considered that the numerical simulation of wearing operation indicates the ship performance very well when the sail is trimmed appropriately.
|