|
APPLICATION OF A VISUALIZATION-BASED COLLISION AVOIDANCE SUPPORT SYSTEM FOR SAFE NAVIGATION OF LARGE-SIZE HIGH SPEED CRAFT IN CONGESTED WATERWAYS
Egil Pedersen and Junji Fukuto
Navigation System Group, National Maritime Research Institute, Tokyo, Japan
Masayoshi Numano and Hiroko Itoh
Maritime Safety Assessment Group, National Maritime Research Institute, Tokyo, Japan
Abstract: Collision risk assessment is a key task for the high-speed craft (HSC) navigator. Large volumes of data on the surrounding marine traffic and environmental condition are available from shipboard navigation sensor sources. However, high relative speed and complicated and congested traffic conditions may cause workloads and stress that challenge navigational safety. Of paramount importance are therefore the quality and availability of anti-collision information and how the HSC navigator process, understand and use this information. The research reported in this paper is on a collision avoidance support system that focuses on visually presenting the collision risk of multiple targets and selection of feasible evasive maneuvers by judging the tip of own ship's velocity vector in relation to cone-shaped collision danger regions in true motion. The support system has been subjectively evaluated in a simulator test experiment by an expert mariner and team of researchers. Scenarios were based on a sea traffic-flow model of Tokyo Bay with about 250 ships operating simultaneously. Own ship employed was a 140 m air-cushion craft (Techno-Superliner) operating with a nominal speed of nearly 40 knots. It has been substantiated that the proposed Visualization-based Collision Avoidance Support System (VCASS) is capable of support early decision-making of complicated and congested traffic situations and therefore enables course-evasive maneuvers to be made well in advance of a developing situation. Proposals for improvements to the man/machine interface for collision avoidance assessment have been made and a set of recommendations and guidelines for efficient target selection and safe course settings of large-size HSC craft in congested waterways has been proposed.
1. INTRODUCTION
1.1 Background and Motivation
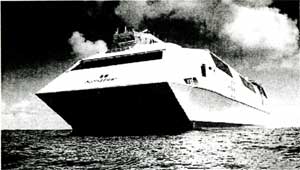
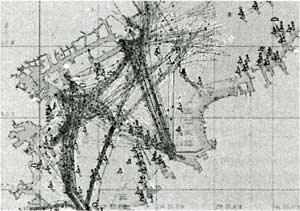
High-speed craft (HSC) with lengths in the excess of 100 m are in regular service, predominantly as passenger/car ferries as for example the Stena Line's generation of large size high-speed ferries in European waters that operate at speeds around 40 knots, Fig. 1. These twin-hulled craft are 127 m long and 19,500 GT (Gross Tonnage) and are able to carry nearly 400 cars and 1,500 passengers at a service speed of 40 knots. The current Japanese large-size HSC project is the Techno-Superliner (TSL), which is a 140 m 14,500 GT passenger/cargo ferry of the air-cushion type designed for about 750 passengers and 210 tons cargo with a service speed of nearly 40 knots. The TSL is scheduled to be deployed in 2005 to operate between Tokyo and the Ogasawara islands, about 500 n. miles south. It will thus be operating in the heavily congested Tokyo Bay with traffic densities of about 250 ships during peak periods, Fig. 2.
Large-size HSC operating in restricted and congested waterways place a high demand on navigational safety issues and the prevention of accidents. Collision risk assessment is a key task for the HSC navigator. Shipboard systems and technologies such as Automatic Radar Plotting Aid (ARPA), Electronic Chart Display and Information System (ECDIS) and Automatic Identification System (AIS) provide vital information on the surrounding environmental and traffic conditions. Correct and time-efficient interpretation of the monitored traffic condition is a key to navigational safety. The time factor is critical in order to make necessary target identification and to assess the risk of collision, and this can be greatly compressed. A particularly essential factor is the man/machine interface of collision avoidance systems as the human ability to process significant amounts of (alpha-numeric) data is limited. The challenge is to present target information in a way that enables the HSC operator in congested waterways to efficiently identify potential dangerous targets and plan course-evasive maneuvers well in advance of a developing situation.
Fig.1 |
"Stena Discovery", a 127 m twin-hull passenger/car ferry operating in European waters, is capable to carry 1,500 passengers and nearly 400 cars at a speed of 40 knots. |
Fig.2 |
Ship traffic lanes and congestion in Tokyo Bay as created and simulated by the Sea Traffic Simulation System SEATRAS [5]. About 250 ships operate simultaneously during the peak hours. |
1.2 Nature of Collision Risk Assessment
The process of collision risk assessment and avoidance action is a fairly complex human multi-tasking that involves the risk for human errors and mistakes. It is composed of the basic tasks of information gathering, processing, decision-making and execution of evasive maneuvers. In multiple encounters and high relative speeds the collision avoidance process can thus impose a significant workload and stress to the mariner.
Navigators evaluate collision risks by visual observations of surrounding traffic (if visibility is clear) and by target data as provided by navigation aid instruments such as the ARPA radar and AIS. It is well known among practical navigators that if the aspect angle to the observed vessel is, or is almost, unchanged, both vessels are likely to be on collision courses. The equivalent radar observation is a relative motion of the target towards the centre of the observer's vessel, i.e. zero distance at closest point of approach, DCPA(L)≈0.
A standard procedure for collision risk assessment when utilizing ARPA radar is firstly to observe true vector display to get an image of the traffic flow, then switch display to relative vector and turn on Trial Maneuver option with forecasting of the effect of a proposed evasive maneuver. The navigator then make the decision on a maneuver, switch Trial Maneuver off and once again observe the true vectors of targets before taking maneuvering action.
For HSC operation in congested waterways the use of Trial Maneuver functionality is generally too time-consuming to be practical. The HSC mariners predominantly evaluate collision risk by studying true vector display and from visually observing changes in aspect angle to targets (visibility permitting).
1.3 Display of Collision Risk
Some ARPA systems are fitted with additional graphic symbols such as Potential Points of Collision (PPC) and Predicted Area of Danger (PAD) as a supplement to the velocity vectors in true motion display. PPC is to be interpreted as if the heading marker goes through the PPC then a risk of collision exists. PPC will lie on the target's true vector or an extension of the vector. The number of PPC (either 0,1 or 2) relates to the course of the target and the relative speed between own ship and target. The numbers and movement of the PAD are governed by the same criteria as that of PPC. The size is determined by the operator selected DCPA limit, but the center is not the PPC. A collision risk exists if the heading marker goes through a PAD.
[4] utilized a risk distribution model to display a potential dangerous area within the maneuvering space around scheduled course line of own ship. This collision risk display enables the mariner to maneuver efficiently with minimum risk of collision, but was reported to require some training in operation. Another concept is the Obstacle Zone of Target (OZT) [2] where the expected collision point is displayed as a circle and considering an estimated error of target's speed. Exact collision risk areas in true motion display are actually cone-shaped regions, [1]. Collision risk to multiple targets and identification of feasible evasive maneuvers can be assessed simultaneously by judging the tip of own ship's velocity vector in relation to the display of collision danger sectors to acquired targets.
This paper is a further development of the display technique [1] to a visualization-based collision avoidance support system (VCASS) with focus on application to large-size HSC operating in congested waterways where the time factor is critical. It is argued that VCASS supports early decision-making of complicated and congested traffic conditions and therefore enables course-evasive maneuvers to be made well in advance of a developing situation.
2. VISUALIZATION-BASED COLLISION AVOIDANCE SUPPORT SYSTEM
2.1 Requirements for Collision Avoidance Support
A collision avoidance support system requires integration of own ship motion parameters and target information that is supplied by independent navigation sensor systems. The target data is normally obtained solely from ARPA radar and some manual operations are required to receive the data. To apply collision avoidance support systems, an automatic target data acquisition system is required. AIS has recently been released to the maritime society and it is expected to provide a large number of target ship data automatically.
To process the target data the system design needs to focus on the man/machine interface in order to provide the collision risk data in an easily understandable manner way such that the display facilitates easy decision-making and thereby contribute to reduce the workload and enhance navigational safety. The system must support the mariner to identify the most dangerous targets in any situation and at any time.
2.2 Collision Avoidance Assessment in True Motion
The mathematical criteria for collision between two approaching vessels, own ship and a target i, can be formulated as,
where V refers to the scalar value of ship velocity vector V (LT-1), α is the aspect angle (relative bearing) and sub-indexes 0 and T refer to own ship and target i, respectively. It follows from Fig.3 and Eq.(1) that the PPC can be moved along the external target's track line if V0 is altered such that its end position touches the bold dashed line that is parallel to the in-sight line between the vessels and drawn from the tip of target's vector (A). Thus, any maneuver that deflects the end of own ship's velocity vector away from the bold dashed line is a potential collision avoidance maneuver. This line can therefore be regarded as a Collision Danger Line (CDL) in true motion.
The CDL is simply created by parallel displacement of the bearing line to the target, a distance equal to the length of VTi, and is therefore independent of the own ship's motion parameters. Hence, it can be drawn to any acquired target. The dotted line from the centre of own ship, parallel to VTi, represents the course that would result in parallel movement. The interception point (B) between this line and the CDL can therefore be regarded as a limit for relevant anti-collision evaluation.
The general solution of the collision scenario is obtained by considering a minimum passing safety distance DCPAlim from which a cone-shaped collision region (dashed lines) can be imagined on a standard ARPA radar in relative motion display from the viewpoint of own ship by utilizing the Variable Range Marker (VRM) to mark the safety region and the Trial Maneuver functionality to identify the course and/or speed change that ensures the relative vector (or elongation of this) deflects outside the safety distance circle. The imagined collision danger sector in relative motion display can be transformed to appear in the true motion display (shadowed sector) as shown in Fig. 4. Any maneuver (real or simulated) that deflects the end of own ship's velocity vector away from the shadowed sector, referred to as Collision Danger Sector (CDS), is a potential evasive maneuver.
Let C and D refer to the points on the DCPAlim circle that determines the position of the tangents through B, see Figs.3 and 4. The cone-shaped collision danger region to target i in true motion display is then determined by the position vectors Xki(L) = { [XkiYki]T}k = {A,B,C,D} whose analytical formulations are derived in the Appendix.
Fig.3 |
Encounter geometry for own ship and a target on collision course(s). Movement of PPC along target's track line is shown by altering own ship's motion parameters, [1].
CDL = Collision Danger Line. |
Fig.4 |
Cone-shaped collision danger regions in relative motion (dashed lines) and true motion (shadowed region) displays, [1]. Own ship will pass astern of target with the required minimum safety distance, DCPAlim.
CDS = Collision Danger Sector. |
|