|
4. SYSTEM ARCHITECTURE
The outline of the display and the system itself has since 1999 undergone several changes. The HOTS system can now be broken down into 5 major components; sensors, display software, display hardware, control panel, and 3D terrain database (Fig.7).
Fig.7 Schematic of display system architecture.
A Furuno Satellite compass provides accurate location, heading, yaw, roll and pitch, while the AIS system and the radar provide information about the location and heading of other target ships in the area. When used in the AUG's HSC simulator a Kongsberg Maritime Ship Systems Polaris simulator provides this information.
Radars are still the most important navigational aid available in the HSC cockpit. In the HOTS system radars information is used to provide information that will enhance attention on the whereabouts of other ships in the area.
Route information is provided trough the ECDIS system by means of waypoints. The trajectory of the route (center line) is calculated in the display computer so that it will best fit the hydrodynamic characteristics of the HSC. This route calculation is then used to layout the visible pathway on the display. In addition the trajectory information is used to select the proper symbology used in marking of the virtual pathway. Straight stretches of the route is marked along the edges with spare buoy-like symbols whiles curved areas in the path is marked with a flag-like symbol indicating the direction of the curve. In addition warning signs are used in the before each curve to give the navigator an early warning and supplementary information. The centerline of the path is marked with rectangular symbols like the centerline on a road.
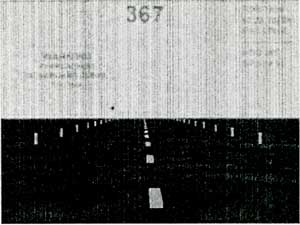
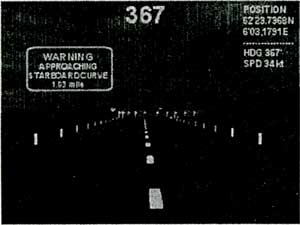
Included in the terrain database are also navigational aid information such as lights, buoys, and spare buoys. This is included so that it is possible to augment the display with important information navigational information that otherwise would be lost during low visibility conditions See Fig. 8 and Fig. 9 for examples of HOTS used during severe fog and at low light (darkness).
Fig.8 HOTS used during severe fog.
Fig.9 HOTS used during low light condition
4.1 Realization
The vast performance improvement in resent years of graphics processors and computing power has made it possible to realize this type of display systems mostly based on COTS components. The current system operates under a Pentium IV 2,4 GHz Dell PC and a GeForce4 Ti4600 graphics card. The rendering engine and terrain engine uses the OpenSceneGraph scenegraph library and is based on OpenGL. Terrain geometry is made using digital elevation data (DEM) supplied by the Norwegian Mapping Agency, whereof shoreline, navigational lights, and marking are extracted from C-Map S57 files. Both are preprocessed through TerreX TerraVistaTM and Multigen CreatorTM to create the final textured digital 3D terrain model.
5. CONCLUSION
This paper has given a description of the on-going synthetic vision research at AUC. The goal of this work is to enhance visual out-the-window information that is lost during operation of HSC's in low-visibility weather. To counteract such degradation, an advanced display in witch the out-the-window scene is enhanced or augmented through is proposed.
Full scale scientific testing and evaluation of the display has not yet been conducted due to delays in completion of AUC's new HCS simulator. A full-scale test is scheduled for the third quarter of 2003.
REFERENCES
[1] Below, C., Viebahn, H. von, Purpus, M.,Flight Tests of The 4D Flight Guidance Display, Proceedings of SPIE Enhanced and Synthetic Vision, pp. 74-80,April 1997.
[2] Grunwald, A. J., Improved Tunnel Display for Curved Trajectory Following: Control Considerations, AIAA Journal of Guidance, Control, and Dynamics, Vol.19, No. 2, pp. 370-377, March-April 1996.
[3] Foley, D. C., Ahumada, A. J., Larimer, J., and Sweet, B. T. (1992). Enhanced/synthetic vision systems: Human factors research and implementation for future systems. SAE Transactions: Journal of Aerospace, 101, pp. 1734-1741.
[4] Foley, D. C., McCann, R. S., and Shelden, S. G. (1995). Attentional issues with superimposed symbology: Formats for scene-linked displays. In R. S. Jensen and L. A. Rokovan (Eds.), Proceedings of the Eight International Symposium on Aviation Psychology, pp. 784-790. Columbus, OH: Ohio State University.
[5] Foley, D. C., Sanford, B. D. and McCann, R. S. (1991) Attentional issues in superimposed flight symbology. In R. S. Jensen (Ed.), Proceedings of Sixth International Symposium on Aviation Psychology, pp. 577-582. Columbus, OH: Ohio State University
[6] Kjerstad, N. (2003). Simulator for training and R&D in high-speed navigation. Presented on conference in Singapore.
[7] Möller, H., and Sachs, G. (1994). Synthetic Vision for Enhancing Poor Visibility Flight Operations, IEEE Aerospace and Electronic Systems, Vol. 9, No. 3, pp. 27-33, March 1994.
[8] Regal, D. M., and Whittington, D. (1995). Guidance Symbology for Curved Flight Paths ", Proceedings of the Eighth International Symposium on Aviation Psychology, April 1995.
[9] Theunissen, T. (1997). Integrated Design of a Man-Machine Interface for 4-D Navigation, Delft University Press, Deift, The Netherlands.
[10] Weintraub, D. J., Haines, R. F. and Randel, R. J. (1984). The utility of head-up displays: Eye-focus versus decision time. Proceedings of the 28th Annual Meeting in the Human Factor Society, pp. 529-533. Santa Monica, CA: Human Factors Society.
[11] Wickens, C. D., Haskell, I., and Harte, K. (1989) Ergonomic Design for Perspective Flight Path Displays, IEEE Controls Journal.
AUTHOR' S BIOGRAPHY
Ove Bjorneseth is an assistant professor at the Institute of Computer Science at Alesund University College in Norway. He has been conducting research within situational awareness for several years. He is currently head of Technical Development at AUC's Center of Simulation and Visualization. He can be contacted at ob@hials.no.
|