|
Period of the strong northwest monsoon winds (from November 18 to 24)
Figures 4(a)-(e) show the same parameters as shown in Figures 2(a)-(e) during
the period from November 18-24. This period is characterized by the strong northwest monsoon wind (westerly
wind burst) reaching more than 20 m/sec of instantaneous wind speed at November 20. Responses of the sea
surface temperature and salinity are shown in Figure 4(b). Sea surface temperatures decrease from 29.5
to 29.3℃ while salinity increases from 34.24 to 34.37 at November 22. The temporal distributions of temperature
and salinity overlaid with ADCP data also illustrate the characteristic responses to the westerly wind
burst. Figures 4(c) and (d) indicate that the Northwest Monsoon Current (NMC) reaches more than 60 cm/sec
at the surface and extends to the depth of 70 m from November 20-2. The temperature and salinity contours
of 29.2℃ and 34.3 to 34.35 psu are sharply uprising respectively. The accelerated NMC caused by the westerly
wind burst is called the Pacific Equatorial Monsoon Jet (PEMJ) ( Lindstrom
et al., 1987). The strong equatorial eastward jet in December, 1986 with the velocity more than 110
cm/sec are also observed ( Delcroix et al., 1992). At the same time the
northwestward flowing New Guinea Coastal Undercurrent (NGCUC) at the depth from 80 m to 120 m is seem
to be decelerated and partly deviated clockwise because of the enhanced NMC or the PEMJ from November
20-21. These aspects of upper oceanographic response lead to a temporal upwelling which is revealed by
the sharp increase of in situ chlorophyll-a concentration from November 19-22 expressed in Figure 5. SeaWiFS-derived
chlorophyll-a concentrations are also shown in the same figure for comparison. It is found that in situ
and SeaWiFS-derived chlorophyll-a concentrations are agreed well each other. It is indicated that the
equatorial Pacific upwelling is defined at the surface by a salinity front ( Rodier
et al., 2000) and the close relationship between chlorophyll-a and salinity distribution has been
discussed ( Radenac and Rodier, 1996). Three distinctive layered current
structures with the Pacific Equatorial Monsoon Jet caused by westerly wind bursts are illustrated in Figure
6.
| (Enlarge: 47KB) |
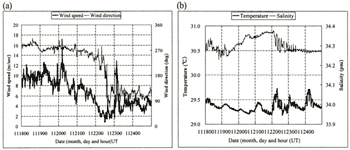 |
Figure 4. Temporal variability of wind speeds and directions (a) and the
one of sea surface temperature and salinity (b) from November 18 - 24
| (Enlarge: 82KB) |
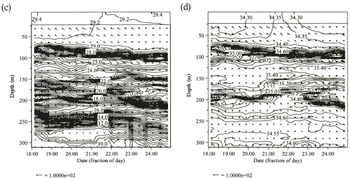 |
Figure 4. Temporal variability of temperature (c) and salinity (d) overlaid
with velocity vectors from November 18 to 24 (Units of temperature, salinity and velocity are degree
Celsius, psu and cm/sec respectively.)
Figure 4(e). Temperature-Salinity diagram with depth from November 18 to
24
Figure 5. Comparison of in situ and SeaWiFS-derived chlorophyll-a concentration
from November 12 to 30
Period after the strong northwest monsoon winds (from November 25-30)
Figures 7(a)-(e) show the same parameters as shown in Figures 2(a)-(c) during the period from November 25-30. This period is characterized by the moderate insolation with the weak monsoon winds shown in Figure 7 (a). During the period average wind speed is 5.2 m/sec. The wind directions are mostly east until November 27 and changing to the west afterwards. Because of the moderate insolation sea surface temperature shows small diurnal variability of 0.5℃elsius. Surface salinity shows a stable value of 34.28 shown in Figure 7(b). Since the wind directions are east until November 27, the Northwest Monsoon Current (NMC) at the surface becomes very weak indicated in Figures 7(c) and (d). On the other hand the New Guinea Coastal Undercurrent (NGCUC) at the depth from 80 m to 120 m shows the stable westward flow of about 50 cm/sec and the Equatorial Undercurrent (EUC) at the depth from 200 m to 250 m is strengthened especially after November 28. Since the northwest monsoon wind and the corresponding NMC are weak, the cause of the strengthened EUC is unknown. However, after comparing with the velocity vectors of the NOGCUC during the previous period it is found out that the total transport of the NGCUC is getting increased toward the latter half of this period and the part of NGCUC may contribute to the enhancement of the EUC. Figure 7(e) shows the temperature-salinity diagram with four different depth ranges. Comparing Figure 2(e) and Figure 4(e) salinity maximums appeared not only at the temperature of 22-24℃ but also at 27℃ in Figure 7(e) which corresponds to the NGCUC at the depth of 100 meters.
| (Enlarge: 20KB) |
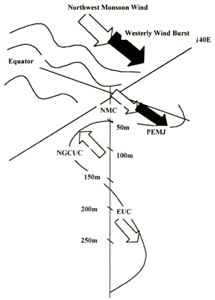 |
Figure 6. Layered current structure with the Pacific Equatorial Monsoon
Jet (PEMJ) triggered by the westerly wind burst (NMC: the Northwest Monsoon Current NGCUC: the New
Guinea Coastal Undercurrent, EUC: the Equatorial Undercurrent)
Figure 8 illustrates the chlorophyll-a concentration composite derived from SeaWiFS data during this period. The concentration around the stationary observation point (2N, 138E) indicates the values higher than 0.1 mg/m3 which are agreed well with the in situ concentration values shown in Figure 5. The high concentration area extends to 4°N and the northern coast of New Guinea Island. However, the low concentration areas are found east of 140 degrees meridian, which may indicate the temporal and spatial extent of the upwelling in this region.
| (Enlarge: 43KB) |
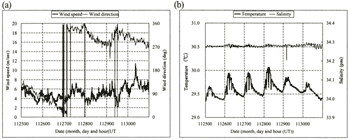 |
Figure 7. Temporal variability of wind speeds and directions (a) and the
one of sea surface temperature and salinity (b) from November 25-30
| (Enlarge: 81KB) |
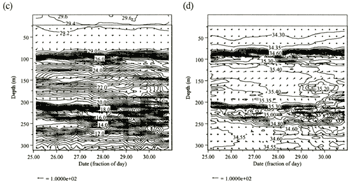 |
Figure 7. Temporal variability of temperature (c) and salinity (d) overlaid
with velocity vectors from November 25-30 (Units of temperature, salinity and velocity are degree
Celsius, psu and cm/sec respectively.)
Figure 7(e). Temperature-Salinity diagram with depth from November 25-30
| (Enlarge: 39KB) |
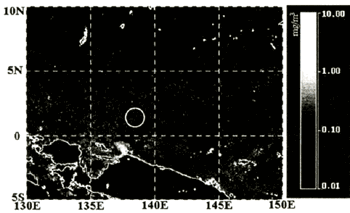 |
Figure 8. Chlorophyll-a concentration composite derived from SeaWiFS data
(November 25-30) (Circle represents the stationary observation area indicating high chlorophyll-a
concentration above 0.1 mg/m3 (after the wind-induced upwelling))
|