|
NAVIGATION SUPPORT SYSTEM
Clarifying the effective use of wave data measured by this system is also within the scope of the project. In this paper a prototype of a navigation support system is proposed. In IMO (MSC Circular 707, 1995), a guidance to avoid dangerous situations in following and quartering seas was adopted. The navigation support system aims at informing the masters to understand the relation between the ship and the waves onboard and helping them avoiding the dangerous situations
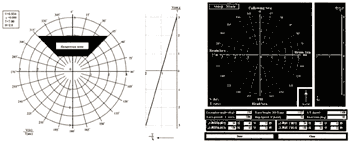
The figure in MSC Circular 707 is shown in the left side of Figure 16. The dangerous zone is colored. This figure is called V/T-diagram (V: ship speed, T: wave period). The display of the support system is shown in the right. The ship position is displayed by a flickering circle. This computer is connected to the main computer as shown in Figure 10. From this system the masters easily understand the ship's situation and how to escape from the dangerous condition.
| (Enlarge: 65KB) |
 |
Figure 16. V/T-diagram in MSC Circular 707 and in the navigation support
system
CONCLUSIONS
An onboard wave monitoring system has been developed using relative wave motions along a ship's side, measured by video image processing, as the main information. For estimating the wave parameters around the ship i.e. height, period and direction, a simple analysis method has been developed. For promoting the possible use of the system a navigation support system onboard is proposed and a prototype is demonstrated.
The accuracy of video image processing was confirmed to be satisfactory. The performance of the simple analysis method for estimating three wave quantities was investigated in a test tank. The total performance of the monitoring system was confirmed to be promising through at-sea experiment. However, these were in limited conditions and it was regrettable that the wave conditions were rather calm. Moreover the effect of neglecting radiation/diffraction waves in the simple analysis method was not investigated theoretically. The problem remained for further development is clarifying the performance and limitation in various sea conditions, experimentally and theoretically, especially in heavy weather.
REFERENCES
Dankert, H., Horstman, J. and Rosenthal, W. 2002. Detection of Extreme Waves
in SAR Images and Radar-Image Sequence, Proc. of 21st International Conference of Offshore Mechanics
and Arctic Engineering
Hashimoto, N., Nagai, T., Asai, T. and Sugahara, K. 1993. Extension of Maximum Entropy Principle Method (MEP) for Estimating Directional Ocean Wave Spectrum, Report of the Port and Harbour Research Institute, Vol.32, No.1.
Hirayama, T., Minami, K., Hiramatsu, M. and Kawauchi, I. 1997. Development
of Hybrid-Type-Onboared-Measuring-System for Directional Wave Spectrum (2nd Report), Journal of the
Society of Naval Architects of Japan, Vol.182, pp.2 17-229.
IMO/MSC. 1995. Guidance for Masters to Avoid Dangerous Situations in Following and Quartering Seas, MSC Circular 707.
Iseki, T. and Ohtsu, K. 1994. Baysean Estimation of Directional Wave Spectra
Based on Ship Motions, Journal of the Society of Naval Architects of Japan, Vol.176, pp.99-105.
Saito, K., Maeda. K., Matsuda, A. and Suzuki, S. 2000. An Estimation of Ocean
Wave Characteristics Based on Measured Ship Motions (3rd Report), Journal of the Society of Naval Architects
of Japan, Vol.187, pp.77-83.
Yoshimoto, H. and Watanabe, I. 1994. On the Estimation of Encounter Directional Wave Spectra of Running Ship, Jour. of the society of naval architects of Japan, Vol.176, pp. 107-116
Young,I.R. and Holland,G.J. 1996. Atlas of the Oceans: Wind and Wave Climate, Elsevier Science Ltd.
APPENDIX Parametric Method for Directional Wave Spectrum Analysis
Parametric method (PM) is a general term of the methods for estimating directional wave spectrum by expressing the spectrum through a parametric model. In this appendix the summary of a PM for measurement on running ships (Yoshimoto et al. 1994) is described. In this method the parametric model of EMEP (Extended Maximum Entropy Principle) (Hashimoto et al., 1993) has been adopted and the directional wave spectrum S(ωe, χ) is expressed as follows,
| (Enlarge: 3KB) |
 |
ωe :encounter angular frequency, χ :encounter angle of hull and wave
a0, an, bn :parameters of the model, N: order of the model.
The maximum value of N is determined by the number of measured data. However, the optimum value is selected based on AIC (Akaike Information Criterion). In case of running ships in following seas, the relations between wave frequency ω and encounter frequency ωe shows complicacy as shown in Figure A-1, where g is gravitational acceleration and V is ship velocity. In this method, parameters are determined with respect to each range, namely Range - I, II and III in Figure A-1
Figure A-1. Relations between wave frequency ω and encounter frequency ωe
In the analysis, cross spectrum of observed ship responses m and n, φmn (ωe), is calculated and compared with the parametric model as shown in equation (A-2), where subscript I, II and III correspond to the ranges in Figure A-1 and subscript * means complex conjugate. Hm means RAO of m-th ship response in frequency domain.
| (Enlarge: 15KB) |
 |
The parameters in equation (A-1) are determined to minimize ε, the estimation error, by Newton-Raphsom method numerically.
|