|
Results of port State inspections by the Tokyo MOU members in 2001
33 The results of port State in sections carried out by the member Authorities of the Tokyo MOU are shown in the following table.
Port State inspections carried out by Authorities during 2001
| Authority |
No. of inspections |
No. of inspections with deficiencies |
No. of deficiencies |
No. of detentions |
No. of individual ships*1) |
Inspection rate (%) |
Detention percentage (%) |
| Australia |
2,913 |
1,788 |
8,881 |
127 |
4,545 |
64.09 |
4.36 |
| Canada*2) |
510 |
365 |
2,231 |
59 |
1836 |
27.78 |
11.57 |
| China |
1,728 |
1,288 |
7,758 |
107 |
8,122 |
21.28 |
6.19 |
| Fiji |
29 |
7 |
19 |
1 |
164 |
17.68 |
3.45 |
| Hong Kong, China |
890 |
693 |
5,413 |
98 |
5,479 |
16.24 |
11.01 |
| Indonesia |
934 |
494 |
1,976 |
3 |
5,216 |
17.91 |
0.32 |
| Japan |
4,498 |
3,335 |
18,297 |
465 |
10,917 |
41.2 |
10.34 |
| Republic of Korea |
2,344 |
1,687 |
7,778 |
116 |
9,162 |
25.58 |
4.95 |
| Malaysia |
380 |
201 |
1,236 |
34 |
5,298 |
7.17 |
8.95 |
| New Zealand |
691 |
298 |
1,234 |
10 |
1,112 |
62.14 |
1.45 |
| Papua New Guinea |
0 |
0 |
0 |
0 |
385 |
0 |
0 |
| Philippines |
359 |
202 |
1,445 |
17 |
2,381 |
15.08 |
4.74 |
| Russian Federation*2) |
650 |
505 |
4,601 |
103 |
866 |
75.06 |
15.85 |
| Singapore |
1,189 |
1,012 |
7,609 |
170 |
11,333 |
10.49 |
14.3 |
| Thailand |
76 |
46 |
242 |
18 |
3,448 |
2.2 |
23.68 |
| Vanuatu |
0 |
0 |
0 |
0 |
38 |
0 |
0 |
| Vietnam |
188 |
128 |
921 |
21 |
1,194 |
15.75 |
11.17 |
| Total |
17,379 |
12,049 |
69,578 |
1,349 |
24,590*3) |
0.71 |
0.0776 |
|
|
| 1) |
LMIS data for 2001 . (Sum of the number of individual ships visits during the first and second half of the year 2001) |
| 2) |
Data are only for the Pacific ports. |
| 3) |
LMIS data for 2001 . (Sum of the number of individual ships visits to the regional ports during the first and second half of the year 2001) |
34 Although there is a considerable difference in the inspection rate of different Authorities in the region, significant improvement has been made in the past few years in the rate inspections carried out by all Authorities, particularly those from developing countries.
Number of port State inspections by different Authorities
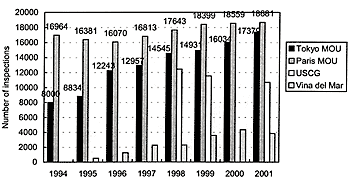
35 Figure 1 below shows the summary of the number of inspections carried out by the Tokyo MOU members (1994-2001) (source: Annual Reports of the Tokyo MOU and data maintained by the Secretariat), the Paris MOU members (1994-2001) (source: Annual Reports), USCG (2001) (source: document submitted to FSIs) and Acuerdo de Vi  a del Mar members (source Internet web-site).
Figure 1 - Number of port State inspections
| (拡大画面:31KB) |
 |
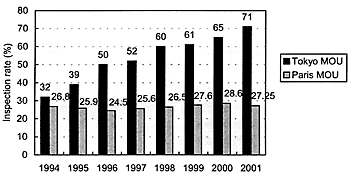
36 With regard to the percentage of port State inspections, there are no uniformed annual statistical data to compare. The Paris MOU data show the percentage of inspections against simple summation of individual foreign ships visits to each member Authorities, whereas the Tokyo MOU data shows the regional inspection rate, i.e. the total number of inspections divided by the number of individual ships visiting the Asia-Pacific ports during the first and second half of the year. Figure 2 shows the inspection rate under the Paris and Tokyo MOUs.
Figure 2 - Inspection rate under the Tokyo and Paris MOUs
| (拡大画面:23KB) |
 |
37 If the Tokyo MOU figure for 2001 is converted to that according to the Paris MOU system, i.e. percentage figure of total number of inspections (17,379) against simple summation of individual foreign ships visits to each member Authorities (49,644), then the inspection rate becomes 35.01%. This figure 35.01% is comparable to 27.25% under the Paris MOU. The US report states that of the 50,539 port calls by 7,842 ships, 10,711 inspections were made during 2001. This means that every ship calling US ports was inspected 1.37 times on average.
Detention rate
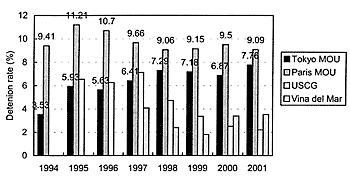
38 Perhaps the statistical data on detentions of ships may be more relevant to indicate the quality shipping. Figure 3 shows the percentage of ships detained, i.e. the ratio of the number of detentions against the number of inspections (in the case of the USCG data, the detention rate is the ratio of the number of detentions against the number of distinct ships arriving US ports).
Figure 3 - Detention rate
| (拡大画面:27KB) |
 |
39 The detention rates under the Paris MOU have generally been leveling out for th e past 4 years. This might be an indication that the quality of ships visiting European ports are improving. On the other hand, the detention rates under the Tokyo MOU seems to be increasing steadily. This might be due to improved method of selection of ships to be inspected, rather than declining quality of ships visiting Asia-Pacific ports.
Detention rate by ship types
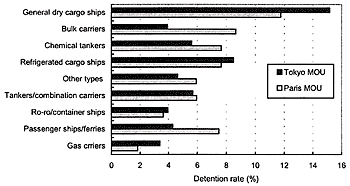
40 Figure 4 shows the detention rate by ship type under the Tokyo and Paris MOU for 2001. It may be noted that the figures under the Tokyo and Paris MOUs show similar trends.
Figure 4 - Detention rate by ship type (2001)
| (拡大画面:19KB) |
 |
Deficiencies by main categories
41 Figure 5 shows the deficiency rate by main category, i.e. percentage of the number of deficiencies under each category to the total number of deficiencies for the Tokyo and the Paris MOU (in case of the USCG data, percentage of the number of deficiencies on detained vessels to the total number of detentions). It may be noted that the largest rates of deficiencies relate to life-saving appliances, fire fighting appliances and stability, structure etc. This trend seems natural because deficiencies on these items are most easily identifiable by port State inspections. However, among the regions some unique characteristics are observed on safety of navigation, SOLAS related operational deficiencies and ISM related deficiencies.
Detention by flags
42 Figure 6 shows flag States with above average detention percentages in each of the regions of the Tokyo MOU, the Paris MOU and the USCG in 2001.
43 The above diagram includes only those data with at least 20 port State inspections in 2001. The figures are not always consistent with each other, primarily because the trade patterns of ships and flag distribution may be different in different regions. Many blank figures are due to the fact that the number of inspections are less than 20 or these flags have lower detention rates in the region. However, it may be possible to identify certain States with high detention rates wherever the port State control is carried out.
YEAR PLAN
44 A schedule for 2002 is attached hereto.
|