SECTION 8. WORLD SHIPBUILDING DEMAND
New orders, completions and the orderbook have increased for all the main shipbuilding regions during the 1990s, compared to the market situation in the previous decade
However, it is clear from an examination of the long-term trends for completions and orders, that the European shipbuilding industry s decline began long before the Koreans entered the shipbuilding market.
Notwithstanding the long term trend, the level of European completions of the total market has fluctuated between 20% and 12% since the mid 1980s, while for the period of the complaint (from 1997 onwards), the volume of European completions has ranged from 18%to 12% of all output.
There have been significant increases in demand in certain sectors, of particular note are the tanker market (particularly in light of the proposed single-hull ban), the LNG market and large containerships. These are all sectors where Korea has a significant competitive advantage.
8.1. Drivers of Shipbuilding Demand
Demand for new ships emerges from five critical drivers:
・ Replacement demand for old ships
Ship "life" is a variable factor. Builders may "design" a set life (say, 25 years) but survival is a function of quality of maintenance, cost of maintenance and earnings potential. Replacement demand, however, may not be like-for-like and this is a crucial factor for shipbuilders. In a weak freight market, ship owners can defer the replacement of vessels, whereas they may choose to bring it forward during a strong freight market.
・ Additional demand created from increased volumes of seaborne trade
For decades, liquid and dry bulk tonnages have shown steady but unspectacular growth(perhaps 1%-3% per annum on average), suggesting the ills of these sectors lie firmly with "oversupply" of ships. In contrast, containerised volumes have been on a rapid growth path.
・ Structural changes in the market place which alter established ship size/type preferences
It has been some time since the market place has seen radical shifts such as that caused by the Suez Canal closure, which spawned the VIcc/Ulcc, or the creation of huge integrated steelmills served by Vlocs. However, the emergence of post-Panamax containerships might be germane today.
・ Speculation
The shipping industry seems to have more than its fair share of optimists. The next upturn is always "the bull run to heaven" (amid market talk of the "new reality"). Bankers, also, seem to be seduced by this sentiment.
・ Politics
Not all shipbuilding demand functions at the "commercial level". This term is used guardedly as it has implications of loss- making or inefficient activities. This is misleading. In this context, demand may come from the military sectors (warships, supply vessels, auxiliaries, submarines, etc.) or other governmental, quasi-governmental or charitable sources (e.g. research vessels, hospital ships, etc.)
In terms of actual shipbuilding demand there are three key variables to monitor:
・ New Orders Placed Each Year
・ Completions Each Year
・ The Size of the Total Orderbook
8.2. New Orders
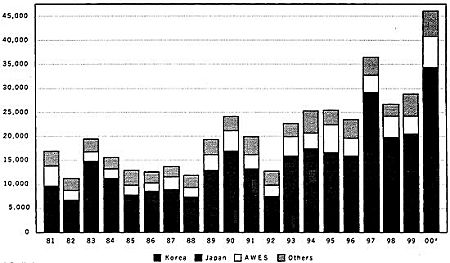
In the period 1981-2000 new orders placed (expressed in gross tons) have ranged from a low of 11.2 million gt to a high of 46.1 million gt. The provisional data suggests that the high was reached in 2000, when new ordering was up by over 15.0 million gt on 1999 (see Figure 8.1).
European builders have benefited from the high levels of new ordering and likewise from the steep depreciation in the Euro. German and Polish yards have been particularly successful in securing orders in the medium sized containership sector, thereby questioning allegations of a Korean 30% subsidy.
Figure 8.1
New Orders (' 000 gt)
* Preliminary.
NB: Ships over 100 gt. From 1996. Poland is included in AWES.
Source: World Shipbuilding Statistics, Lloyd's
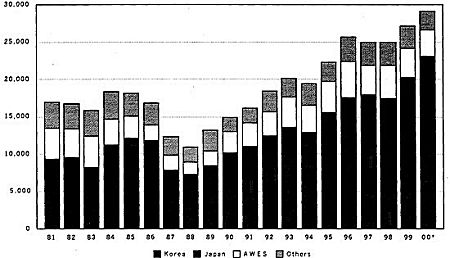
Figure 8.2
Completions (' 000 gt)
* Preliminary.
NB: Ships over 100 gt. From 1996. Poland is included in AWES.
Source: World Shipbuilding Statistics, Lloyd's
8.3. Completions
In the period 1981-2000, annual vessel completions have ranged from a low of 10.9 million gt, to a high of 29.1 million gt. Once again the high position was reached in 2000. European completions in 2000 were provisionally estimated at 3.5 million gt.
While it is clear that Korea's market share has increased since the late 1980s, so has Japan's. Also, Figure 8.2 clearly shows that the level of AWES completions has significantly increased since the late 1980s, when Korea really began to have an impact on the shipbuilding market. This makes allegations of injury to European yards much less sustainable.
As demonstrated in the table in Annex 1 showing completions by year, the AWES market share (in terms of gross tonnes) has been in decline since the 1970's, long before any Korean challenge.
Since this decline preceded the entry of Korea onto the market, the European allegations of injury caused by Korean yards are clearly open to question. Indeed, in absolute terms, the AWES volume of completions in GT has not altered significantly since the beginning of the 1980s.
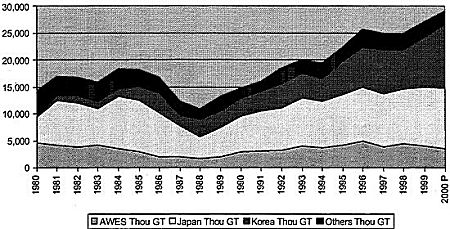
Figure 8.3
Completions by Year (Thousand GT)
Source: World Shipbuilding Statistics
Note: 1. Ships over 100GT
2. From 1996, Poland included in AWES
3. P: Preliminary
In terms of market shares of completions, the AWES market share has fluctuated between 12% and 20% since the middle of the 1980s. In the period covered by the complaint AWES market share has ranged between 12-18%.
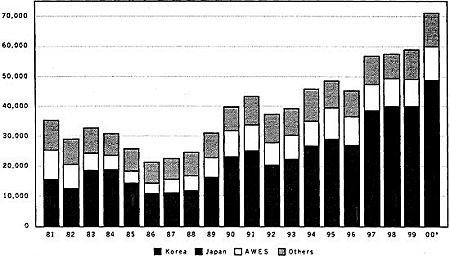
8.4. Orderbook
The world end-year orderbook has ranged from a low of 21.3 million gt to a high of 71.1 million gt at the close of 2000. White it is apparent that the Korean orderbook has grown in the late 1990s, the European orderbook has not declined significantly over the same time-scale
This suggests that the Korean expansion has been due to the increased newbuilding demand rather than at the expense of the existing market shares of its competitors. In turn, this seems to indicate a higher level of competitiveness when it comes to securing contracts arising from increased demand, rather than any predatory behaviour which has targeted the existing markets of competitors.
Again, it is difficult for the Europeans to claim injury when their orderbook has increased significantly since the late 1980s/early 1990s.
Figure 8.4
Orderbook (' 000 gt)
* Preliminary.
NB: Ships over 100 gt. From 1996, Poland is included in AWES.
Source: World Shipbuilding Statistics, Lloyd's