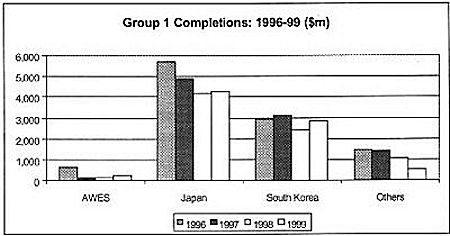
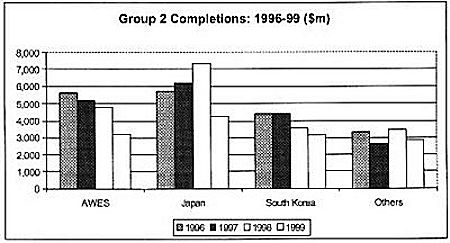
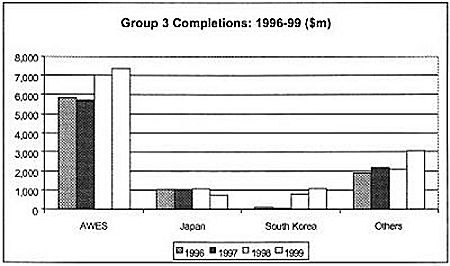
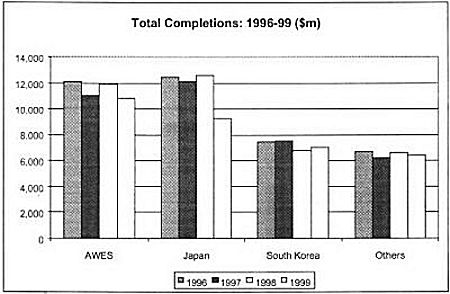
4.3 Value of Ships Built
However, when one examines market share in a different way, a completely different picture emerges. On the basis of the value in US dollars of vessels completed in each region, it is clear that Japan dominated Groups 1 & 2, while Europe has by far the greatest share of Group 3 completions.
The huge difference between Europe and its competitors in Group 3 demonstrates the difference in value added for these vessels. However, the concept of value added points to an interesting factor also. For the vessel types where the total cost comprises a larger proportion of value added, most of the benefit derived from the contract goes to the yard. Meanwhile, for the lower value-added vessels in Group 1&2, a larger proportion of the value added goes to the suppliers since materials and equipment form a larger proportion of total costs.
The total completions by value graphs clearly demonstrate that, in these terms, Europe has the largest market share, whereas Korea comes a distant third behind Japan.
Figure 4.11
Completions by value
Source: AWES
Source: AWES
Figure 4.11 Cont'd
Source: AWES
Source: AWES
The new orders by value graphs give a similar picture to those by cgt, except that these too demonstrate that the Europeans have not really had a presence in Group 1 for a while, and that they still dominate new orders in terms of value.