SECTION 4. EU AND KOREAN YARDS OPERATE LARGELY IN
DIFFERENT MARKETS
The changing shares in the shipbuilding market are not a result of the Europeans retreating from sectors in which Korea has established a presence. In fact, the European yards had already moved away from ship types such as tankers and bulk carriers in the 1970s in the face of Japanese competition.
Today, European yards are not as competitive for large tankers and bulk carriers, where low labour costs combined with few higher productivity and lower costs of materials provided Korean yards with a decisive and quite legitimate competitive advantage.
Instead, European yards have chosen to focus on specialist high value sectors such as cruise vessels, a market in which Korea has no presence.
As a result, European yards dominate the cruise ship orderbook, and as a result, have an orderbook, which is higher in value than the Korean orderbook, due to the high cost of cruise ships.
4.1 EU/Korean Market Presence in Shipbuilding
AWES divides the shipbuilding market into three principal groups:
| ・ Group 1: |
Oil Tankers, Bulk Carriers and Combination Carriers. |
| ・ Group 2: |
Multi-purpose, Reefers, Containers, Ro/Ro, Car Carriers; Product/Chemical Tankers, LPG Carriers and LNG Carriers. |
| ・ Group 3: |
Ferries, Passenger, Fishing, Non-cargo vessels. |
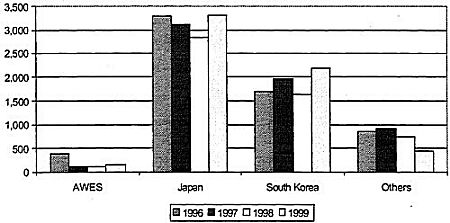
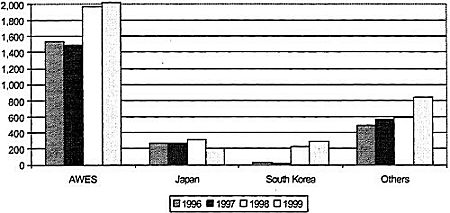
4.1.1 Group 1
Examination of completions and new orders indicates that Europe is unable to compete with either Japan or Korea, which, at least until 1999, was the market leader. However, as will be shown later, Europe had been progressively losing out in this sector since the 1970s.
Figure 4.1
Group 1 Completions by CGT ('000)
Source: AWES
Group 1 ships are effectively the most basic of the "market ships". In the (shipping) marketplace, this is the area where there is likely to minimum leeway on price. Logically, this dictates that "success" is linked to volume building. This in turn links to maximising scale economies in steel and equipment purchasing and requires high productivity and low labour costs. This sector transferred from Europe to Japan. Japan has kept itself in pole position through to 1999. Chinese vessels are also beginning to enter this market.
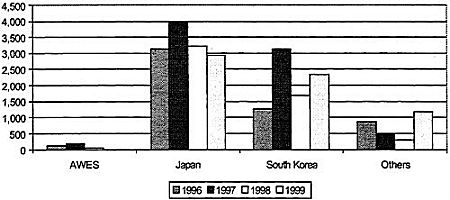
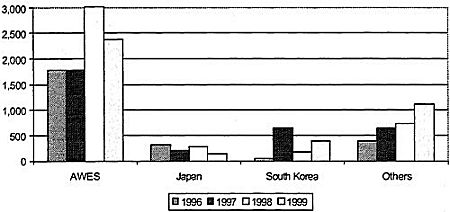
Figure 4.2
Group 1 New orders by CGT ('000)
Source: AWES
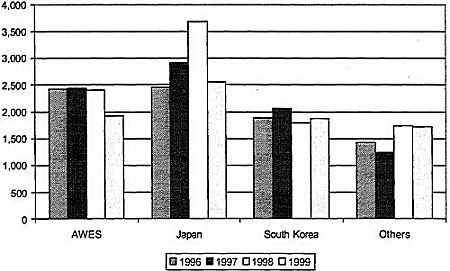
Figure 4.3
Group 2 Completions: 1996-99 by CGT ('000)
Source: AWES
4.1.2 Group 2
The Group 2 market is somewhat more balanced though, in terms of new orders, Korea was the most successful of the principal builders in 1999. However, Japan had a remarkable year for orders in 1997 so one cannot read too much into a single year's figures without further examination.
The Group 2 market is, in ship terms, a rather eclectic mix. There are some "struggling" sectors, for example multi-purpose cargoships and reefers, which have lost share to containerships, Ro/Ro tonnage has tended to be more successful in local markets than in global trading and this sector can blur with car carriers (or pure car truck carriers as they are now more likely to be) and cargo and passenger/cargo ferries, white products tankers and containerships are edging closer to a "market ship" definition (as with Group 1 types) and the same may be evolving for LPG carriers.
Given this, a reasonable expectation might be a mixed picture but, with the "specialisation threshold" falling in some sectors, there appears to be a trend away from Europe, for the same reasons that the Group 1 market was eroded.
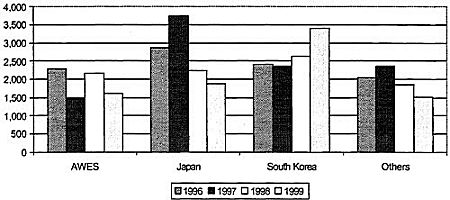
Figure 4.4
Group 2 New Orders: 1996-99 CGT ('000)
Source: AWES
The key Group 2 sub-components are containerships and specialist tankers. The completion pattern for dry cargo/containerships, which is a sector dominated by containerships, shows increasing buoyancy up to 1998 prior to a noteworthy retrenchment in 1999, which impacted across all building regions except, perhaps, China.
Table 4.1
Containers
Group 2
Dry Cargo/Container
Completions-'000 cgt |
1994 |
1995 |
1996 |
1997 |
1998 |
1999 |
Containerships |
| 1998 |
1999 |
| AWES |
1558 |
1316 |
1850 |
1791 |
1954 |
1447 |
1185 |
656 |
| Japan |
1494 |
1697 |
1342 |
2091 |
2686 |
1692 |
1553 |
649 |
| S.Korea |
606 |
874 |
1455 |
1688 |
1434 |
807 |
1148 |
418 |
| Others |
528 |
636 |
711 |
727 |
1082 |
1013 |
591 |
413 |
| Total |
4185 |
4524 |
5359 |
6297 |
7155 |
4990 |
4477 |
2137 |
| |
Group 2
Dry Cargo/Container
Orders-'000 cgt |
1994 |
1995 |
1996 |
1997 |
1998 |
1999 |
Containerships |
| 1998 |
1999 |
| AWES |
1528 |
2887 |
1773 |
876 |
1738 |
1374 |
560 |
829 |
| Japan |
1794 |
1579 |
2268 |
2583 |
1575 |
891 |
673 |
283 |
| S.Korea |
1253 |
1595 |
1756 |
690 |
1820 |
2521 |
1395 |
2400 |
| Others |
562 |
927 |
1344 |
1304 |
1491 |
932 |
535 |
334 |
| Total |
5136 |
6988 |
7141 |
5453 |
6623 |
5718 |
3163 |
3845 |
Source: AWES
This is mirrored in the order pattern for 1997. Subsequently, South Korea looks to have made a decisive upward move. The explanations for this trend that might reasonably be put forward are:
・ The containership orderbook has increased dramatically in the post-Panamax sector, reflecting the changing structure of the containerised trades. These are the largest containerships being built. Hence, individual orders will generate a higher cgt figure.
・ Korea has been most successful in building know-how and technology for the "large ship end" of the market.
・ These vessels serve service strings, so the likelihood is a need for repeat orders for several ships of the same design, delivered within a short space of time.
・ Korea has not made a similar impact in smaller containership sectors, including feeders.
・ A significant prop to this market, the previous tax concessions granted to German shipowners under the German KG system, has been undermined. German owner/managers serving the containership charter market now have to consider other price/financing mechanisms. These operators are functioning with ''market ship" (i.e. "tramp market") motivations and drivers. "Market ships" (and these ships are not hugely sophisticated) gravitate to Group 1 rather than Group 3.
For gas, chemicals and products carriers, the 1999 completions reflect the exceptional order year in 1997 in Korea. However, Japanese builders almost doubled their orders in 1997. In 1999, Japanese orders overtook Korea.
Table 4.2
Specialist Tankers
Group 2
Gas/Chemicals/Products
Completions-'000 cgt |
1994 |
1995 |
1996 |
1997 |
1998 |
1999 |
| AWES |
314 |
434 |
572 |
652 |
443 |
447 |
| Japan |
782 |
770 |
1107 |
832 |
1002 |
856 |
| S.Korea |
479 |
392 |
426 |
376 |
349 |
1067 |
| Others |
462 |
493 |
709 |
516 |
646 |
698 |
| Total |
2036 |
2089 |
2814 |
2376 |
2440 |
3068 |
Source: AWES
Table 4.2 Cont'd
Group 2
Gas/Chemicals/Products
Completions-'000 cgt |
1994 |
1995 |
1996 |
1997 |
1998 |
1999 |
| AWES |
547 |
357 |
512 |
576 |
433 |
237 |
| Japan |
633 |
1206 |
591 |
1163 |
666 |
986 |
| S.Korea |
430 |
374 |
653 |
1654 |
815 |
886 |
| Others |
814 |
340 |
696 |
1040 |
371 |
591 |
| Total |
2424 |
2277 |
2452 |
4433 |
2285 |
2670 |
Source: AWES
The aggregation of these groups may be a little misleading. The larger product tankers are to a large extent "market ships". The smaller vessels tend to be more sophisticated. Gas carriers can be more specialised still. However, the technology and design of containment has come down to less than a handful of options so "efficiency" can win out over "tradition".
4.1.3 Group3
The Group 3 market, excluding perhaps fishing vessels, appears to have the highest "sophistication threshold" to cross. At present, Europe is dominant. In part, this is due to experience and expertise, and the claimed lack of certain skills (e.g. in outfitting) within Japan, Korean and Chinese shipyards.
Figure 4.5
Group 3 Completions: 1996-99 CGT ('000)
Source: AWES
Given its dominant position in the Group 3 sector, and the lack of serious external competition, it would not be an unreasonable expectation for European yards, if they are well-managed and efficient, to be profitable in this sector; especially since utilisation levels at many European yards appear to be at healthy levels
Although much has been made of the threat from Korea to European dominance in the cruise sector, the long production cycles and high outfit content are generally regarded as being adverse to the production flows in Korea's volume shipbuilding yards. Samsung had sought to enter into the cruise building market, but in the case of a billion dollars worth of contracts from HAL it is reported that Samsung declined to take a loss simply for market entry purposes
Figure 4.6
Group 3 New Orders: 1996-99 CGT ('000)
Source: AWES
The Group 3 completions graphs clearly demonstrate the dominance of Europe in this sector. In fact, even for Group 2, and despite the fall in European production in 1999, European completions were still around the same as Korea's.
4.1.4 Summary
The fundamental conclusions that the AWES data points to are:
・ Europe has long been uncompetitive in the Group 1 sector. It is unreasonable to expect Europe to return to this sector and it is doubtful if any EU builder would want to target this sector. Consequently, price, competition and capacity developments exclusively affecting this market sector are of little relevance to Europe.
・ Europe dominates Group 3. Indeed, it is the only sector of the three where the data suggests lack of competition.
・ Group 2 might merit a little further scrutiny, which is provided above.