2. GENERAL MARKET ANALYSIS
As regards the analysis of the existing gap between supply and demand in shipbuilding capacities little progress has been made since the first report. The three major shipbuilders' associations AWES (Association of European Shipbuilders and Shiprepairers) and SAJ (Shipbuilders' Association of Japan) on the one hand, and KSA(Korean Shipbuilders' Association) on the other, do not agree on the extent of this gap, and predict future demand and supply at different levels. However, both sides agree that the gap between supply and demand will widen in the coming years due to increased yard productivity, the conversion of some repair yards to newbuilding and the entrance into the market by new competitors such as the People's Republic of China.
Whether this additional capacity can be partly compensated by increased demand is extremely difficult to forecast. While the age structure of the existing fleet or the up-coming European legislation on the earlier phasing out of tanker tonnage that is considered technically unsafe seem to indicate rising future demand, this could be offset by slow growth of the world economy or the US economy losing momentum.
Moreover, it cannot be assumed that all tonnage of a certain age will be replaced as the construction of some of these ships was based on speculation and these ships should never have come into operation. As mentioned in the first report the huge decline in ship prices since 1997 has again led to speculative orders and it is obvious that this additional tonnage will reduce future demand. Another important factor would be the oil price which at a certain level may trigger energy saving measures and thus reduce the need for sea transport.
The total new building capacity worldwide currently amounts to ca. 21 Mio. cgt(compensated gross tonnes, a measurement combining ship size and shiptypespecific building effort; source: OECD and AWES). Total new shipbuilding production was 16.4 Mio. cgt in 1999 after 17.2 Mio. cgt in 1998 and 16.4 Mio. cgt in 1997 (source: Lloyd's Register of Shipping) which indicates that demand is indeed considerably lower than supply and a significant increase in newbuilding prices due to higher demand cannot be expected, at least in the short term.
2.1. Market shares
A complete analysis of the market situation in shipbuilding requires to look a three sets of data:
- Completed and delivered ships, as the indicator for the actual shipbuilding output. These production related figures represent the execution of past orders;
- Orderbooks, as the indicator for the expected mid-term output. These figures show the yards' confirmed workload in the next 1 to 2 years; and
- New orders, as the indicator for the expected long-term output. These figures reflect the actual situation in the market, including for example speculative movements, and can be used to analyse shifts in market shares.
As this report cannot cover the full history of the shipbuilding market, this specific analysis is limited to the period 1997 to 1999 when the impact of the massive expansion of Korean shipyards and the ensuing economic crisis began to be felt in the world market.
The following graphs provide information on the development of deliveries, orderbooks and new orders, based on cgt and per major shipbuilding region. Each graph is followed by a short analysis.
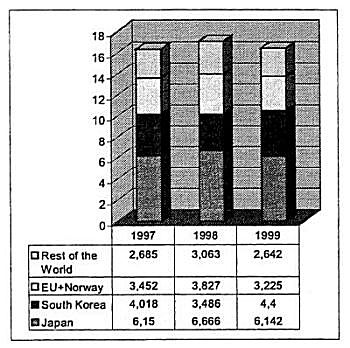
Fig. 1 - Completions 1997-1999 in Mio. cgt and per region (Source: Lloyd's Register of Shipping)
As already mentioned in the first report 1998 was an exceptional year for world shipbuilding as the financial crisis in South Korea hampered ship production and order intake in Korea. However, the trend in completions appears to be an increasing share for Korea while overall production output is comparatively stable but nowhere near the estimated shipbuilding capacity of ca. 21 Mio. cgt. The "surplus capacity" has to be seen at about 20 - 25% of the actual production.
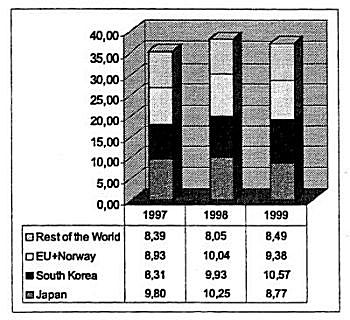
Fig. 2 - Orderbooks 1997-1999 in Mio. cgt and per region (Source: Lloyd's Register of Shipping)
Between 1997 and 1999 the overall volume of orderbooks has increased by ca. 5% and it can be said that this increase has basically only benefited Korean competitors. Japan is confronted with shrinking orderbook volumes while the EU has been able to keep its share at a comparatively high level. Korea, however, has seen an increase in the volume of orderbooks by some 27% while EU yards saw an increase in their orderbooks along the general trend only in the period in question. A shrinking in the volume of orderbooks is an indicator for a worsening business situation in the midterm future and if the additional information on new ordering is included, conclusions on the prospective commercial situation can be drawn.
Fig. 3 - New orders 1997-1999 in Mio. cgt and per region (Source: Lloyd's Register of Shipping)
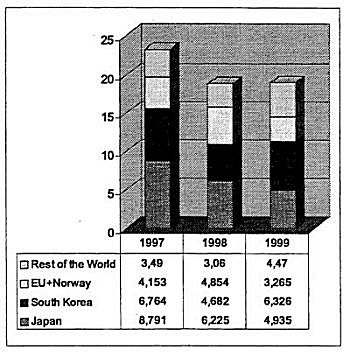
As regards reported new orders which are the key indicator for the actual market situation the picture changes significantly: in particular Japan has lost market share to Korea with fewer orders even in the exceptional year 1998 when Korean yards had problems to compete for orders. The general trend clearly indicates that Korean shipbuilders have conquered market shares in new orders and this has been mainly at the expense of Japan (minus 44% in cgt in the period 1997-1999) while the EU saw a decrease in new orders similar to the general development (minus 18% in cgt in the same period). While EU yards may still have some "breathing space" due to their comparatively good orderbooks (although the situation is very different for different yards) and the lower value of the euro in relation to the US Dollar, Japanese yards are generally facing a situation where orderbooks are increasingly running empty and new orders are not received on a sufficient scale to maintain production at the previous level. This would indicate a longer-term shift in market shares from Japan to Korea and, to a lesser extent, from the EU to Korea.
It is obvious that the booming production of cruise vessels with their comparatively high cgt values has stabilised the overall situation of the EU shipbuilding industry but it needs to be noted that currently only 9 EU yards (out of some 150) are active in this field and the number of yards which could easily turn to cruise ship construction is limited by technical and commercial constraints. Moreover it is known that Korean and Japanese yards are actively pursuing cruise ship orders (with Japan appearing to try to compensate for orders lost to Korea in other market segments). Once the market is confident that Asian yards can produce cruise ships in time and in sufficient quality this European market niche will certainly be challenged and overall EU market shares may shrink further. While the above analysis seems to indicate that EU yards still have a comparatively good position (although this does not necessarily mean that operations are profitable), the situation in particular Member States and for particular shipyards may be dramatically different, depending on their product portfolio. Most threatened are small to medium sized yards that have a focus on the production of merchant cargo ships such as container ships, product tankers or gas carriers. These yards typically do not have the option to compensate a loss in market share through the construction of large cruise ships or navy contracts, even if their general competitiveness in terms of productivity may be good, and some insolvencies have already occurred. The recent developments at Harland and Wolff in Belfast indicate that bigger shipyards are facing similar problems, especially when certain strategic orders cannot be secured and other market segments have become inaccessible due to Korean competition.
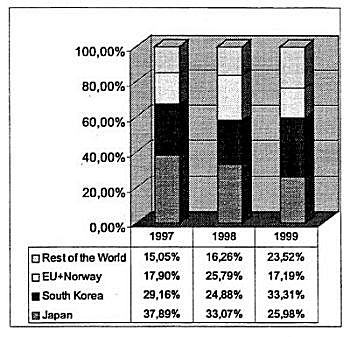
Fig. 4 - Market shares in new orders in percent and based on cgt, 1997 - 1999(Source: Lloyd's Register of Shipping)
Looking at the development in market shares expressed in cgt-percentages the sharp rebound of South Korea after the problematic year 1998 is obvious. The EU yards were not able to maintain their 1998 position when they benefited from the financial insecurity in Korea. China has also taken more market share, but this has been selective as discussed in the next chapter. In 1999 South Korea achieved 33.3% of all new orders, Japan had 26.0%, the EU stood at 17.2% and the rest of the world had 23.5%. This makes South Korea now the world's largest shipbuilding country by far.
In January 2000 Korea saw an even more dramatic increase in order intake: 65% of all world ship orders in January were awarded to Korean yards, representing 72% of the entire cgt volume. The EU achieved a mere 7% in cgt terms and Japan stood at 10%(source: Lloyd's Register of Shipping). In February 2000 the situation for the EU improved significantly (29% market share in cgt) due to a number of orders for specialised tonnage. Japan, however, was not able to gain more market share and it should be noted that total ordering activity went down by 44% as compared to January. The orders mainly concern Postpanamax container ships, a shiptype which has been invented in Europe in 1988 and which until recently was a domain of EU and Japanese yards. This shiptype is widely seen as the "work horse" of future container shipping and it represents a new economic dimension in global sea trade due to its size and efficiency. It should be in the EU's strategic maritime interest to maintain the competence for the construction of these vessels. Moreover Postpanamax container ships are a product of the EU's most modern and technologically advanced shipyards and if these yards cannot attract these orders the reasons must be sought beyond the question of industrial competitiveness as such.