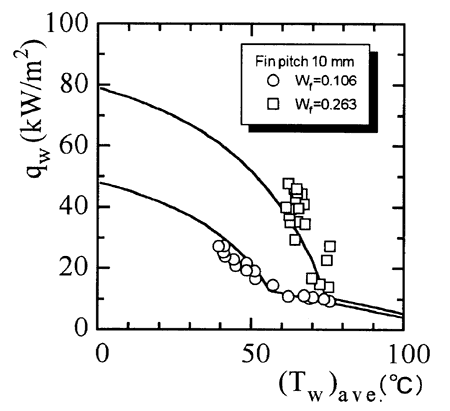
Shown in Fig. 11 is the relation between the total heat flux and the average base tube temperature of fin tube of pitch 10 mm with and without steam injection. The steam mass concentration wf was 0.106 without steam injection and increased to 0.263 with the steam injection of 46 kg/h. The corresponding dew point increased from 56.2亷 to 74.5亷. The solid lines predicted by the simple analogy correlation agree well with the experimental heat flux with and without steam injection.
丂
3.3.2 Fin tube of pitch 5 mm
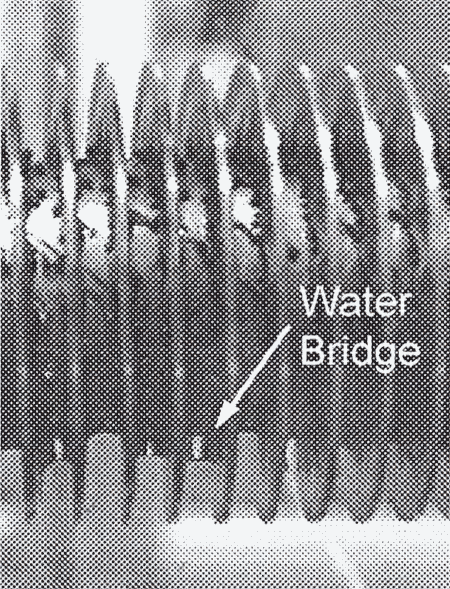
The same condensation behavior was also observed in the fin of pitch 5 mm. Due to the narrow fin pitch, the water bridge between the lower fin was observed as shown in Fig. 12. The photograph was taken at the base tube subcooling of 儮 Tsub = 0.3 K. Asymmetric temperature distribution is also suggested in the photograph as same as that in the fin tube of pitch 10 mm.
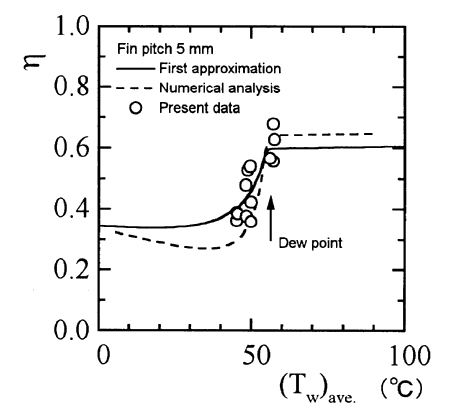
Shown in Fig. 13 is the relation of experimental fin efficiency and the average temperature of base tube comparing with those obtained from the numerical calculation and the first order approximation, increasing the base tube temperature, the experimental fin efficiency sharply drops at the dew point of 55.9亷. The experimental efficiency agrees well with that obtained with the numerieal calculation assuming the symmetrical heat flow in the fin. The asymmetric temperature distribution at the lower fin observed in the above photographs does not have a significant effect on the total fin capability.
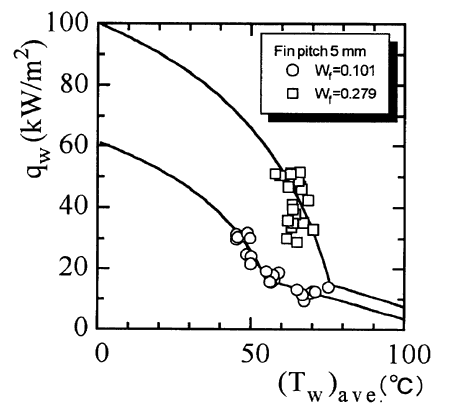
Shown in Fig. 14 is the relation between the total heat flux and the average base tube temperature of fin tube of pitch 10 mm with and without steam injection. The steam mass concentration wf was 0.101 without steam injection and increased to 0.279 with the steam injection of 51 kg/h. The corresponding dew point increased from 55.1亷 to 75.7亷. The solid lines predicted by the simple analogy correlation agree well with the experimental heat flux with and without steam in jection.
丂
Fig. 11 Relation between heat flux and average base tube temperature of fin tube of pitch 10 mm.
Fig. 12 Water bridge between the fins
Fig. 13 Fin efficiency at pitch of 5 mm