subscript
a: atmosphere, C: condensation, COX: carbon dioxide and monoxide, d: dry gas. F: fuel, f flue gas, V: convection. W: wall, N: standard condition at 0℃ and atmospheric pressure, sat: saturated condition of steam, sub: subcooling, wt: wet gas
3. SINGLE STAGE TUBE EXPERIMENT
3.1 EXPERIMENTAL APPARATUS AND METHOD
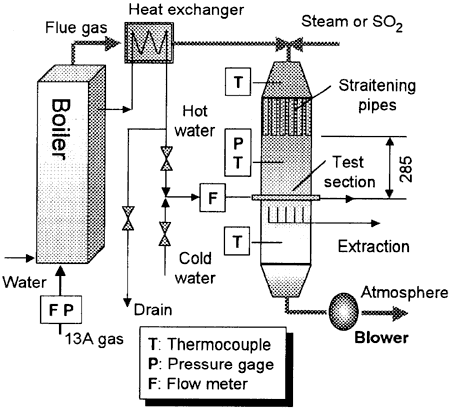
Shown in Fig, 1 is a schematic of experimental apparatus. The flue gas from a natural gas test boiler was cooled from 270℃ to 120〜200℃ by a heat exchanger without the condensation. The steam and SO2 concentrations in the flue gas can be controlled with steam and SO2 injections systems upstream of the test section. The steam was supplied from another steam boiler and measured with a vortex-shedding flow meter. The error was within ±2%, of the measured value. The flow rate and pressure of the natural gas fuel supplied to the test boiler were measured. The error of the flow rate was within ±0.5%. The flue gas temperatures just above and below the test tubes were measured with sheathed K-type thermocouples of 0.5 mm in diameter.

Fig. 1 Schematic of experimental apparatus

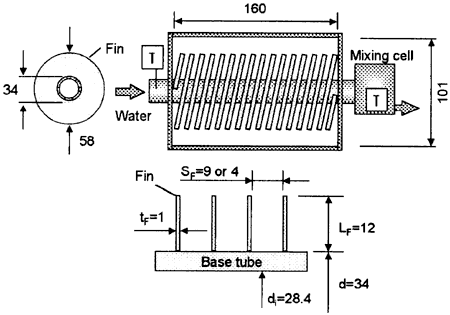
Fig. 2 Test section of spirally finned tube
A water cooled test tube with spiral fin of SUS304 was installed in a transparent polycarbonate duct with the cross-section of 160mm × 101 mm as shown in Fig.2. The water flow rate was measured with a turbine flow meter within an error of ±2%. The inlet and outlet water temperatures of the test tubes were measured also with the sheathed K-type thermocouples of 0.5 mm in diameter. The outlet temperature was measured at a mixing chamber to obtain a well-mixed bulk temperature. The temperature difference of the cooling water through the test tubes was kept approximately at 1〜4 K. The heat flux of the test tubes was calculated with the flow rate and the temperature difference of cooling water through the tubes. The measurement error of the heat flux was estimated to be 20% as the maximum in the non-condensation region and 5% as the minimum in the condensation region. The thermocouple signals were transferred to a personal computer with a GPIB line and analyzed. The measurement error of the temperature in this study was within ±0.1 K.
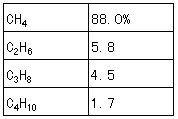
Table 1. Composition of natural gas fuel (13A)

The composition of natural gas fuel used in the test boiler is shown in Table. 1. Volumetric concentrations of N2, CO2, O2 and CO in the dry gas were measured by a gas analyzer. The measurement error was within ±10 % for CO2, within ±0.7 % for O2 and within ± 15 % for CO. By using the measured concentration, the air ratio μ is calculated as

The molar fraction of the carbon in the fuel of 1 mol can be calculated as,
CCR = 1 × 0.88 + 2 × 0.058 + 3 × 0,045 + 4 × 0.017 mol
By using the volumetric flow rate of the fuel VF, the volumetric flow rate of the carbon dioxide and monoxide, VCOX, is
VCOX = VF ・ CCR (2)
The volumetric flow rate of dry gas Vd is,

The molar fraction of the hydrogen corresponding to COX of 1 mol can be calculated as,
CHR = (4 × 0.88 + 6 × 0.058 + 8 × 0.045 + 10 × 0.017) / CCR mol
Considering that the air flow rate necessary for the combustion of the fuel is VdN2/0.79, the volumetric fraction of H2O in the flue gas can be estimated as

where Psat is the saturation pressure of steam in the air.
Shown in Fig.3 is a comparison of the predicted dew points by using Eq.(4) and the measured ones with a capacitance-type humidity sensor. The measurement error of the dew points was ±2℃ in the experimental condition. The calculated dew points by Eq.(4) agree well with the measurement.
BACK CONTENTS NEXT