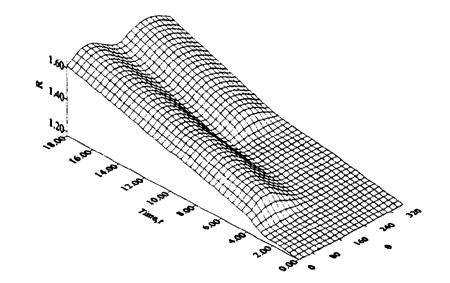

Figure 9. The exact shape of frost growth in numerical test case 2.

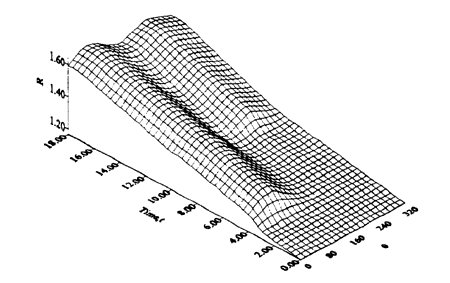
Figure 10. The estimated frost shape using
Γ20 = Γ2 (x,y,O), σ = 0.0 and M=9 in test case 2.

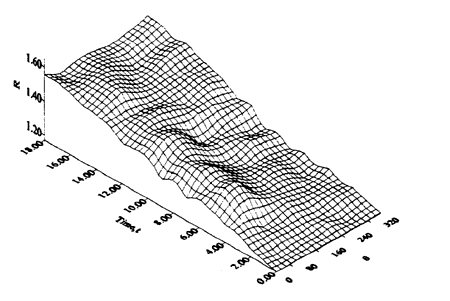
Figure 11.
Γ20 = Γ2 (x,y,0), σ = 0.3 and M=9 in test case 2.

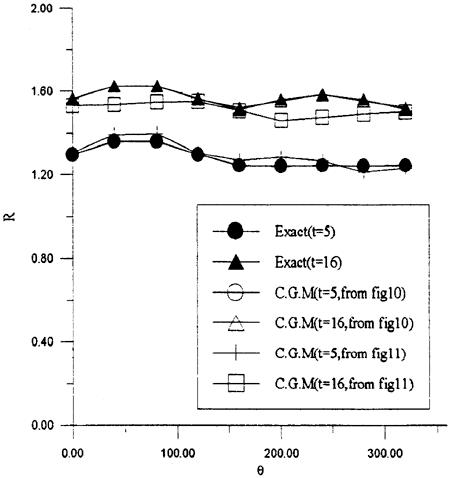
Figure 12. The estimated frost shape extracting from Figures 10 and 11 at time t=5 and t=16
BACK CONTENTS NEXT
|

|