
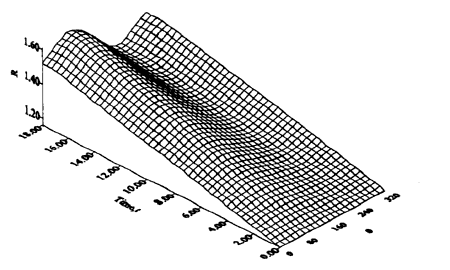
Figure 4. The estimated frost shape using
Γ20 = Γ2 (x,y,0), σ = 0.0 and M=9 in test case 1.
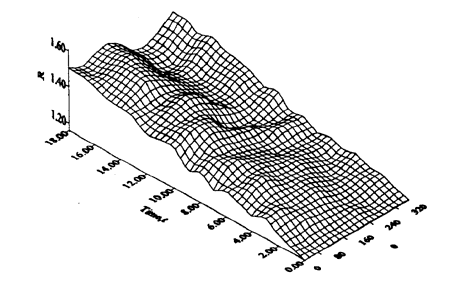
Figure 5. The estimated frost shape using
Γ20 = Γ2 (x,y,0), σ = 0.3 and M=9 in test case 1.
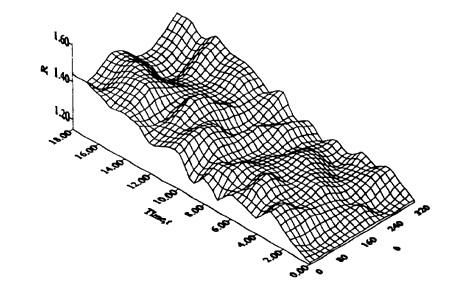
Figure 6. The estimated frost shape using
Γ20 = Γ2 (x,y,O), σ = 0.9 and M=9 in test case 1.
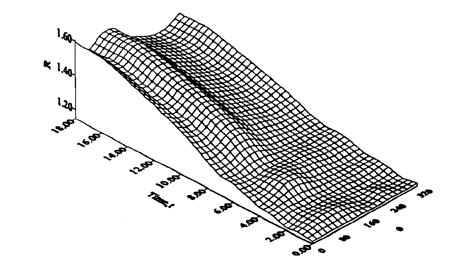
Figure 7. The estimated frost shape using
Γ20 = Γ2 (x,y,0), σ = 0.0 and M=5 in test case 1.
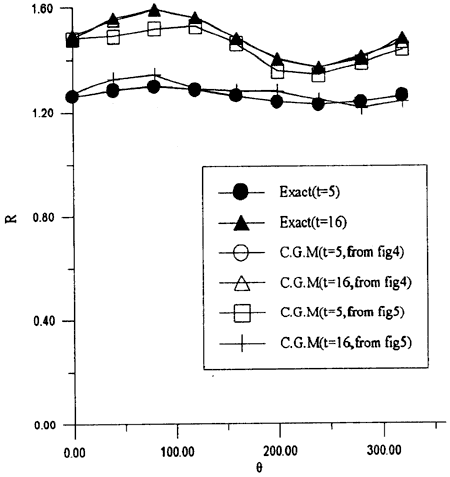
Figure 8. The estimated frost shape extracting from Figures 4 and 5 at time t=5 and t=16.
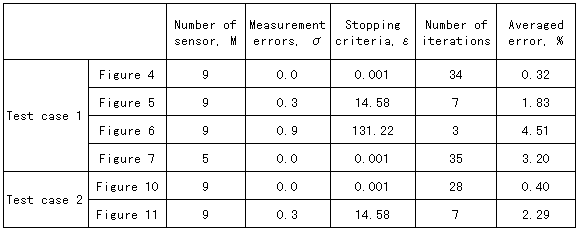
Table 1. Summary of numerical test cases 1 and 2.
BACK CONTENTS NEXT
|

|