2.1 Dilatometric Diagram of lron-Carbon Steel
In thermal treatment, the behaviour of iron-carbon steel is illustrated by a dilatometric diagram in Fig.1 [4], on which we denoted 4 specific temperatures and 3 main thermal zones created in the workpiece during heating cycle and their limits.
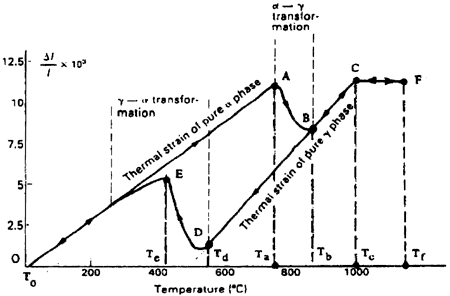
T0 = ambient temperature (in℃)
Ta = peak temperature at the beginning of phase transformation in heating cycle (in℃)
Tc = Peak temperature at the beginning of melt liquid transformation in heating cycle (in℃)
Tf = fusion temperature = maximum temperature at melting zone centre in heating cycle (in℃)
FZ = fusion zone, limited by Tf and Tc
HAZ = heat affected zone, limited by Tc and Ta
NHAZ = non heat affected zone, limited by Ta and T0
2.2 Metallurgical Diagram of Iron Carbon Steel
The typical characteristic of steel is the phase changes (solid-liquid-solid) going with the crystalline structural transformation (ferrite-austenite) and defined by the metallurgical phase diagram. Figure 2 below shows the approximate correspondence of the thermal zones with the peak temperatures of phase changes in a butt weld joint [5].
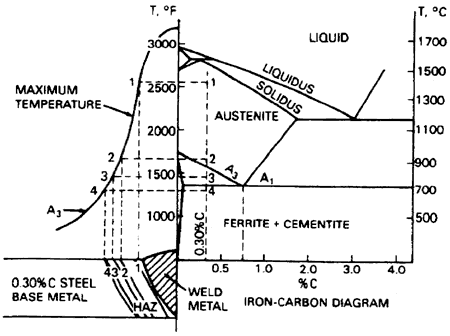
Fig.2 : Approximate relationships between peak temperatures, distance from weld interface and iron-carbon phase diagram [5]
2.3 Solidification Time
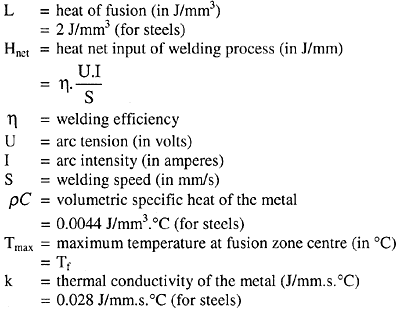
The cooling cycle immediately starts at the end of the heating cycle in all parts of the workpiece and a little later in the melting zone after a solidification time which is expressed by the following relation [5]:

where:
268-4.gif
2.4 Cooling Rates
The cooling rate at any point on the workpiece depends on the peak temperature Tp at this point and on the plate thickness t.
The "thin" or "thick" plate of workprece is defined by the following relation [8] :
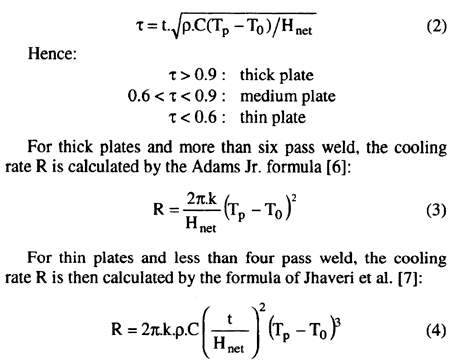
For medium plates, the cooling rate may be obtained (with a maximum error of 15%) by means of these two extreme values [8].
2.5 Schematic Analysis
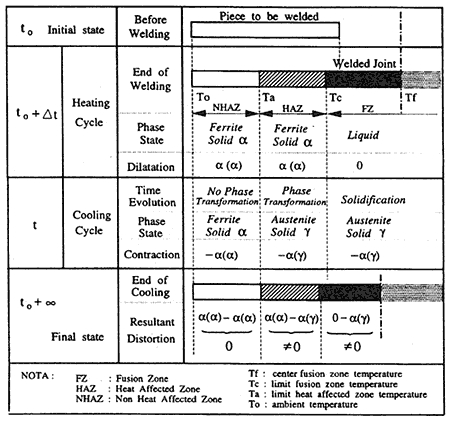
In welding process, the deformations in three main thermal zones during two cycles (heating and cooling) are illustrated by the following schematic analysis Fig.3 [3]:
