Physical system modelling differs from "applied mathematics" its emphasis on the physical system to be modeled and not on the mathematical solution techniques. The teaching of "how to do modelling" is not the same as "teaching of models". Someone has said "If your students are hungry, don't give them fish, but teach them how to fish". Modelling needs to be learned and the proper place to start is at a university.
Concurrently in higher education and in interdisciplinary work, an application-oriented need is manifest, to have a systematic and logical basis for the process of modelling. In addition, computer aided means of constructing a suitable model is a must if simulation is to have a prosperous future in engineering activity.
Over the years, many people have considered modelling issues associated with engineering systems and have contributed methods for modelling. However, not very many of these methods are suitable for computer aided modelling or useful as an engineering tool for industrial applications. In the author's opinion, the Bond Graph Methodology is at this time the only method which has the potential to become the powerful tool for system analysis, as the Finite Element Method has become for structural analysis.
The argument for the statement made above is that it contains some key attributes such as
・it has a strong link between the physics of an object and the model of it
・it is able to represent interacting physical domains in a unified compatible manner
・it has a logical systematic basis well suited for teaching modelling
・it can be performed directly on a computer screen
・it is well suited for using reusable sub-models
The bond graph language is a transparent graphical language in which the bas features of engineering systems can be described and which is amenable to direct computer solution.
In the following short introduction is given to indicate what bond graphs are.
5. BOND GRAPHS
Bond graphs are a unified graphical notation for the representation of dynamic models of interacting subsystems involving all form of energy. This notation leads to a graphical description of a dynamic system very much resembling a chemical bond diagram in appearance. The basic concept behind the bond graph is that power is the fundamental constraint in physical system and is the one variable that is common to the whole system. Thus, the essential feature of the bond graph approach is the representation of energetic interactions between systems and system components by an energy bond.
Professor H.M. Paynter of the Massachusetts Institute of Technology invented the basic idea of a graphical representation of the power interaction among general dynamic subsystems in 1960. He named his graphs bond graphs since he thought of them as analogous to bond diagram in chemistry. The elements and topology of the bond graph representation provide a conceptual reticulation of the real system into elements drawn from a set of ideal, but physically realizable, lumped parameter components. The reticulated structure represents a conceptual separation of the energy storage and dissipation processes within the system and a description of the system.
5.1 Signal variables and basic elements
Although there are text-books available explaining the basic concepts of bond graphs [1], this section will outline the underlying ideas for those who may not be familiar with them. References [2, 3, 4, and 5] indicate some examples of systems, which have been bond graphs.
The fundamental component of a bond graph is the power bond used to couple the energy ports of system components as shown in Figure 1. The half arrow shows the direction in which the positive power is flowing.
The successful use of bond graphs depends to a great extent on choosing a set of variables, which describes the instantaneous power, balance within a system. In a wide class of energetic systems the propagation of energy, or power, is given by the product of two quantities, an effort variable, e, and a flow variable, f.
Figure 1.
Effort and flow variables are called power variables because their product represents power flowing between subsystems.
Power flow = e(t)・f(t) (1)

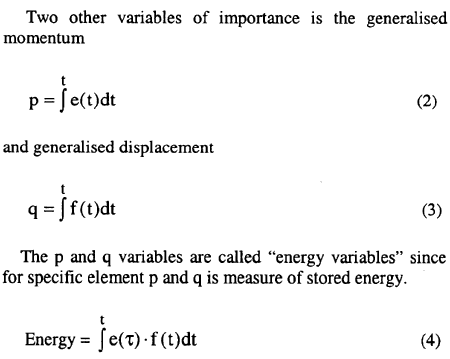
Momentum and since displacement variables can be used to represent system energy and thus state variables and hence their physical interpretation is straightforward.
Using the classification of power and energy variables presented previously, it turns out that only nine basic types of multi-port elements are required in order to represent models in a variety of energy domains. These multi-ports function as components of subsystem and system models. They are, in many cases, idealized mathematical version of real components, and in other cases they are used to model physical effects. The nine basic multi-ports are classified in Figure 1 , according to the way they process energy. Roughly speaking, these elements account for energy supply. dissipation, storage and transduction from one mode to another (i.e. the conversion of energy from one form to another) .