
Figure 4: "Soft limiters" control strategy illustration [19]
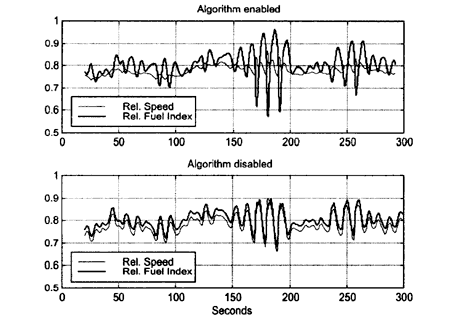
Figure 5: "Soft limiters" strategy results [19]
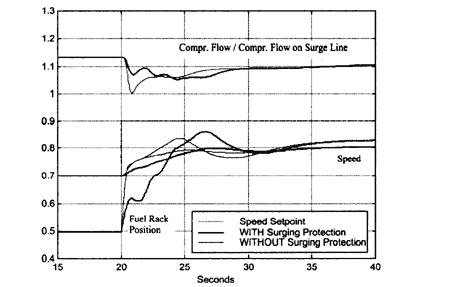
Figure 6: Effect of speed setpoint surge [19]
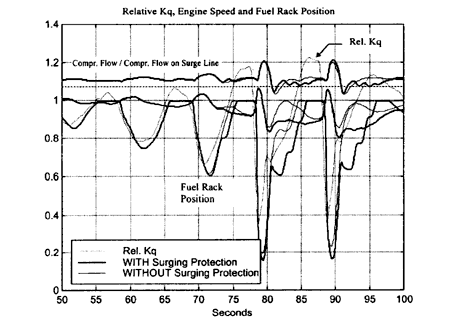
Figure 7: Effect of sudden load drops on compressor increase on compressor surge [19]
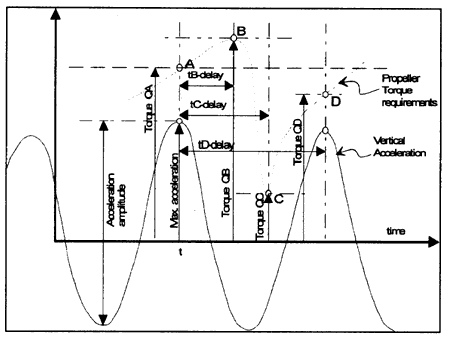
Figure 8: Propeller torque demand prediction model Conceptual picture
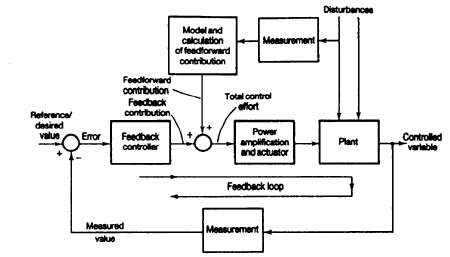
Figure 9: ACME methodology block diagram
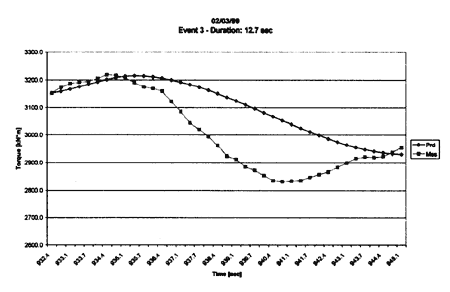
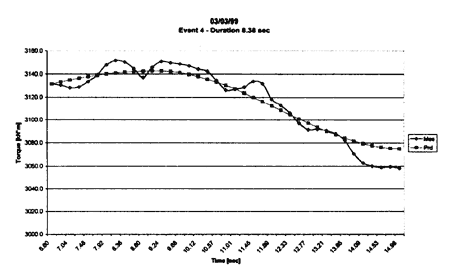
Figure 10: Typical prediction events
BACK CONTENTS NEXT