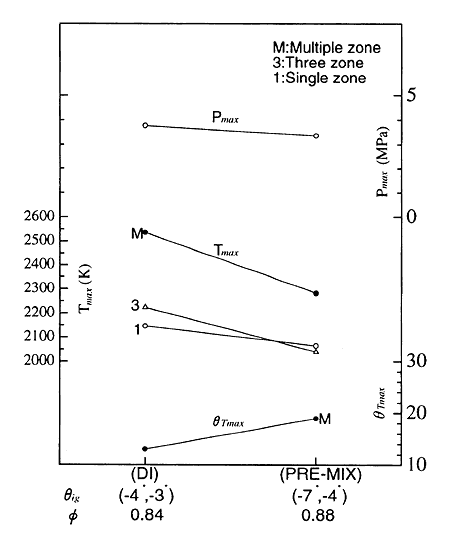
Fig.15 Comparison of results for typical cases in premixed charge and direct injection

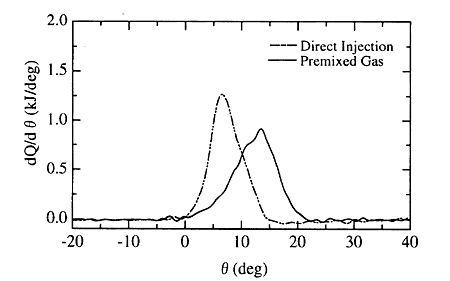
Fig.16 Heat release rate of cases in Fig.15
Table2

In the premixed case, the difference in Tmax between single zone and 3-zone model vanishes, and is reversed. This may be explained by considering a delay in extending the burnt region due to the retarded heat release.
6-2. The Prediction of the Cycle Performance
In this section, the effect of injection timing on the cycle performance was examined on the basis of the experimental results described in the preceding section. The cases of θ = -120°,and-90° at the ignition timing of (-4° ,-3°) are compared. Respective heat release pattern is approximated by using the Wiebe's function as follow,

where a = 3.29, m = 9.98, θv = 29°CA for case (a), and a = 3.22, m = 10.27, θv =22.5° CA for case (b).
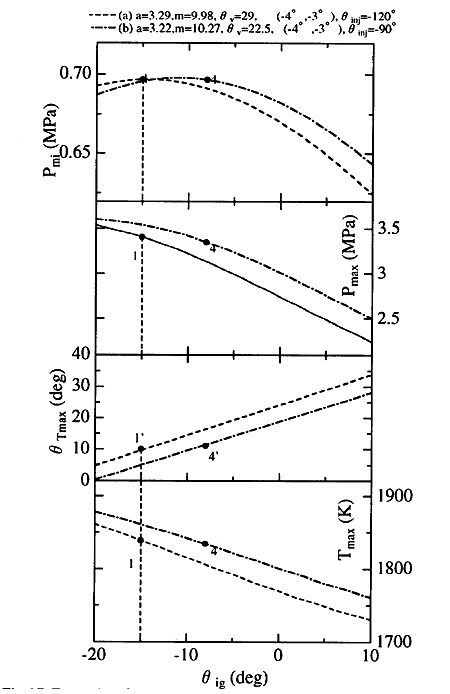
A change of performance with the ignition timing is estimated, assuming that the heat release pattern does not change even if the ignition timing is altered. The calculated results are shown in Fig.17. The maximum Pmi corresponding to the injection timing of -120° appears at θign = -15°, whereas in the case corresponding to 0 ign = -90°, it appears at θign = -8°. This means that the preferable ignition retard can be made if such a heat release pattern is possible by means of a proper control scheme. If a comparison of these two patterns is made at the ignition timing of -4°, it can be seen that the experimental results are well illustrated by the simulation. The tendency to the reduced NOx can be explained by the reduced maximum temperature, and the retarded crank angle at the temperature in the case of the advance injection timings at -120°.

Fig.17 Example of cycle simulation based on the heat release rates for the cases: θinj = -90°, θinj = -120°at θign = (-4, -3)
BACK CONTENTS NEXT