Table 3 Fluctuation Factor and Reference Value (CGE1)

Table 4 Result of Multiple Regression Analysis (CGE1)


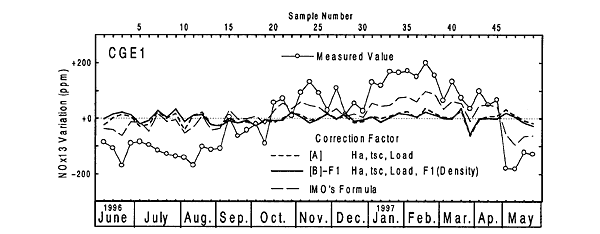
Fig.4 Variation of NOx Concentration as Measured and Corrected (CGE1)
It was also high from November to March because of demand for the power of heater. The absolute humidity of ambient air supplied to the engines rose during the early-summer rainy season and remained high during the summer. It was low during the winter. The fluctuation of absolute humidity was approximately 20 g/kg. Measured NOx-concentration values were low during the summer and high during the winter, with a fluctuation of 400 ppm to 500 ppm.
3.4 Multiple Regression Analysis
The NOx-concentration correction coefficient KHDIES is defined as shown by Eq. (3). In Eq. (4), fci and fcRefi are the actual value and reference value of a fluctuation factor.

The correction factors included 1] absolute humidity (Ha), 2] ambient (room) temperature (ta), 3] intercooled air temperature(tsc) and 4] engine load(Load). According to the results of the research that the authors conducted, it was found that medium-speed diesel engines' NOx emission characteristics were influenced by the ignitability of fuel [2], [3]. Therefore, in this study, 5] fuel properties, including fuel oil density (F1) , cetane index (F2) and CCAI (calculated carbon aromaticity index; F3) are also considered as NOx correction factor.
Using the value of

as the target variable while the measured values of the individual correction factors as explanatory variables, the authors obtained the Kfci and multiple correlation coefficient of each correction factor through multiple regression analysis. As the corrected NOx concentration, the average of all measured NOx-concentration sample data was used.
Table 3 shows the minimum, maximum and average values of the individual correction factors that were measured over the year. In this analysis, the averages were used as reference values for the factors (fcRefi).
BACK CONTENTS NEXT