The detailed drawing of heat exchanger can be shown in figure 10. Heater and cooler have adopted plate fin and tube type heat exchangers. Gas temperature measurements of both spaces are carried out by means of the K-type thermocouples in the exit and entrance of heater and cooler.
丂
2) Engine performance prediction
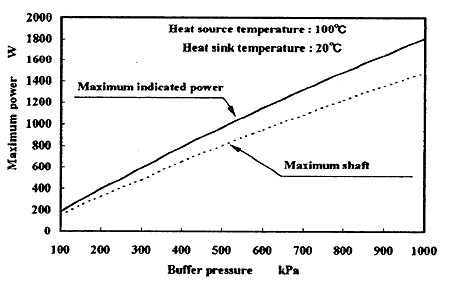
Figure 11 shows the calculation results of performance prediction which simulates the relations between buffer pressure and maximum power using the specifications of 1kW low temperature difference Stirling engine. Computation model for the performance prediction is the 2nd order method of the isotherm model considering temperature change in the cylinder. The calculation condition is 100亷 at the higher side temperature, and the lower side temperature is 20亷. Here, mechanism efficiency for the calculation of shaft power refers to mechanism efficiency [4] of 300W engine, which is e=0.95. From this figure, it is proved that both maximum indicated power and maximum shaft power increase almost rectilinear corresponding to the buffer pressure. Maximum shaft power of about 1.5kW and maximum indicated power of about 1.8kW could be expected at the buffer pressure of 1MPa.
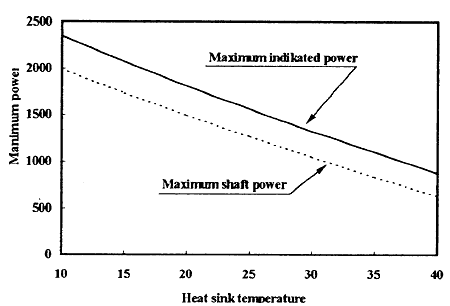
Figure 12 shows maximum indicated power and maximum shaft power when the higher side temperature to be 100亷 and the lower side temperature to be changed. From this figure, shaft power drops from 1.5kW to 1kW when lower side temperature rises from 20亷 to 30亷. Dropping ratio is 33%. And, when lower side temperature is changed from 20亷 to 10亷, shaft power increases from 1.5kW to 2kW, increases 33%. As a result, abilities of the heater and cooler are very important, because the output power is greatly affected by changing the temperature of only 10亷. In addition. it is considered that flow rate of hot and cold water influences the heat quantity supplied to the working gas in the engine.
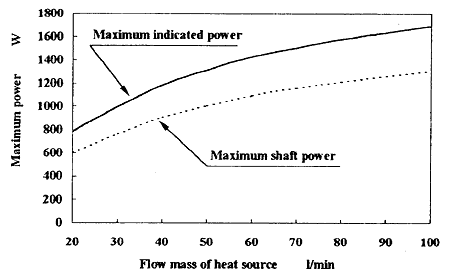
Figure 13 shows maximum indicated power and maximum shaft power when the flow rate of hot water of the heat source is changed. It is using the quasi-steady flow model [5]. In this figure, the buffer pressure is 1MPa, higher side temperature is 100亷, lower side temperature is 20亷. From this figure, it is proven that flow rate of hot water is required more than 50 l/min.
丂
3) Experimental Result and Considerations
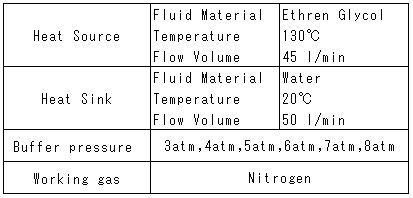
The test equipment system is similar to figure 2. Details of the system have improved in many items referring to experimental results of 300 watt engine and calculation results of performance prediction. The capacity of the electric heater for heating the ethylene glycol is increased from 10kW to 30kW. It can provide sufficient heat capacity to avoid temperature drop in the high buffer pressure operation. Pump system was also changed in order to set the flow rate of 45乣50 liter. The experimental conditions can be shown in table 4.
Figure 1 4 shows relations between engine speed and gas temperature of each parts at the buffer pressure of 500kPa. From this figure, the heat source temperature respectively keeps about 133亷 and heat sink temperature is about 20亷. The expansion space side gas temperature becomes 100乣110亷, and compression space side gas temperature becomes about 33乣35亷. The tendency of the temperature difference of both space is shown. It decreases as engine speed rises.
丂