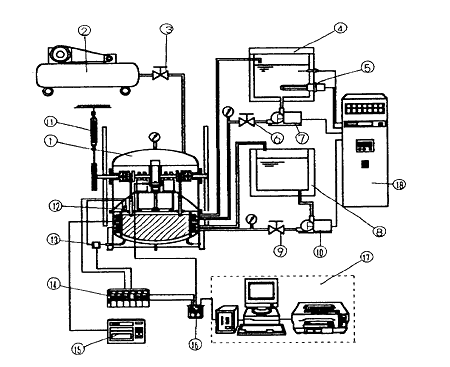
1.Test engine
2. Air compressor
3. Pressure control valve
4. Constant temperature water bath
5. Heater for heat source
6. Flow control valve
7. Pump for heat source
8. Water Bath
9. Flow control valve
10. Pump for coolant Water
11. Spring balancer
12. Pressure transducer of cold end
13. Differential pressure gauge
14. Strain amplifier
15. Hybrid recorder
16. A/D converter
17. Personal computer
18. Central control panel
Fig.2 Diagram of Test Equipment
2) Experimental Method.
The experimental equipment system is shown in figure 2. We use ethylene-glycol for the heat source. It is heated in the high temperature tank at the fixed temperature. The heat sink uses tap water. By using a pump, the heat source circulates between engine and high-temperature tank. Flow rates are set by using area flow meter. Gas temperature in the engine, heat source and heat sink temperature are measured by K thermocouples. These are monitored and recorded by the hybrid recorder as time mean temperature.
Pressures are measured by the pressure gauge installed on the wall of the low-temperature space side. The measurement of pressure losses caused by gas now is detected by the differential pressure gauge installed between compression space and expansion space. These signals are treated by dynamic strain amplifiers, then inputted to the personal computer through an ND converter. From these data, an indicated power is being calculated. A shaft power is calculated by torque and engine speed. The buffer pressure (back pressure of the piston) is provided by the air introduced from the compressor into the buffer space, and it is set by the pressure regulator to the fixed buffer pressure. The experimental conditions are shown in table 2.
3) Experimental results and considerations
Figure 3 shows the relationship between engine speed and temperature of each part when buffer pressure is atmospheric pressure (101.3kPa). Inlet temperature and outlet temperature of the hot water are slightly dropped, as engine speed rises. It is confirmed that there is a tendency of decreasing the temperature difference. It shows that supplied heat quantity to the engine increases corresponding to the engine speed. It seems that there is a heat capacity shortage in the high revolution speed region, because heat source temperature and flow rate in the high-temperature tank are being fixed.
Table 1 Specifications of 300W class Stirling engine
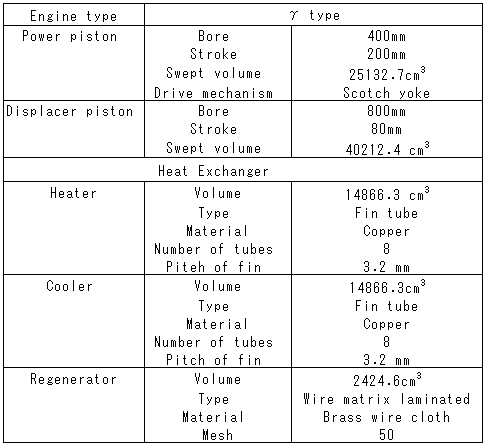
Table 2 Experimental Conditions
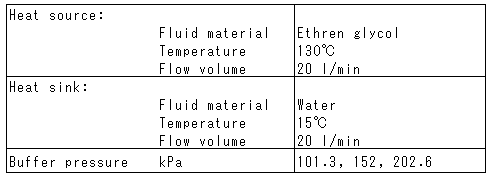
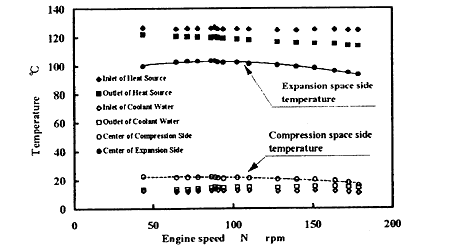
Fig. 3 Relation Between Engine Speed and Gas Temperature
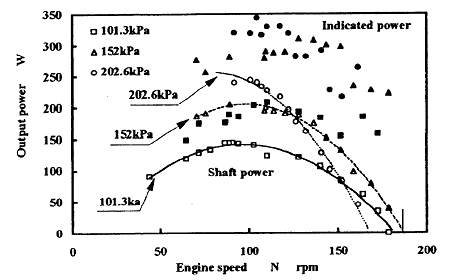
Fig. 4 Engine Performance of 300W Class Stirling Engine
BACK CONTENTS NEXT