A finite-volume based, commercial CFD package was used, and the computational results were compared with the measured data. The results in pressure losses showed good agreement at design I.V.R., on the other hand, the difference was larger at higher I.V.R.
丂
2. Wind Tunnel Test
丂
2.1 Test Facility
For this test, circulating-type, low-speed wind tunnel was used. The available maximum velocity is approximately 30 m/s, and the velocity is changeable by controlling the blower rotating speed with an inverter motor. The test section was rigidly supported at the open space of the wind tunnel, and the I.V.R. was adjusted by changing the flow rate through the intake duct. Below (I.V.R.)n of 2.5, the flow velocity in the main stream (U) was kept approximately 30 m/s. Beyond this (I.V.R.)n, the flow rate through the intake duct (Q or Vs) was kept constant and the flow velocity U was reduced. The Reynolds number at the design point was 1.1 亊 105. Downstream the test section, an orifice plate was installed and the volumetric flow monitored in each measuring point or I.V.R.
丂
2.2 Test Section
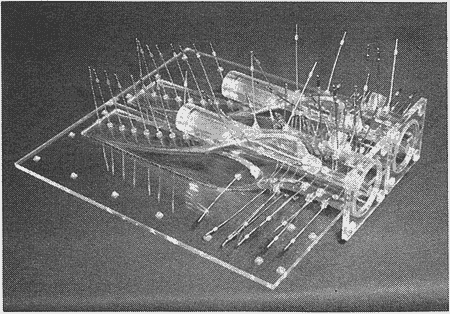
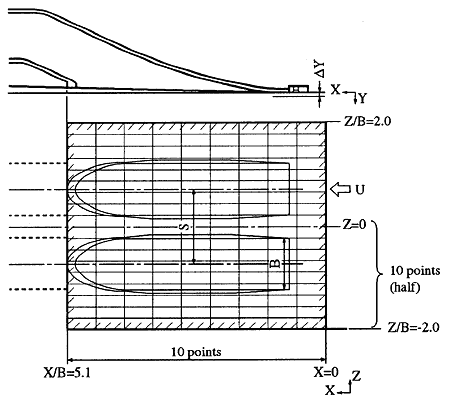
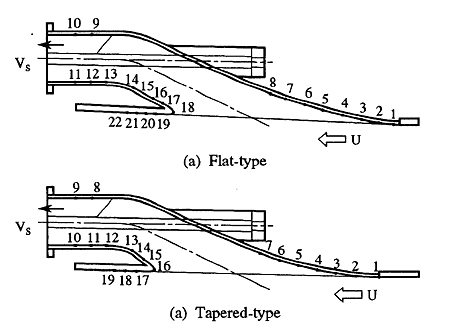
A photograph of plastic models is shown in Fig.1. Two intake ducts were properly aligned to simulate the ship bottom. The flow speed U was determined by the total and static pressure measured by a reference pressure probe. On the other hand, the total pressure at the exit of intake duct was calculated by the wall static pressure plus the dynamic pressure based on the average duct exit velocity Vs. Then, the pressure loss coefficient 兡 was calculated using these measured values. During the flow pattern measurement near the ship bottom, a five-hole Pitot tube was traversed on the measuring plane shown in Fig.2. Moreover, pressure taps shown in Fig.3 were made to measure the local static pressure along the intake duct wall.
Since an actual ship has a grid at the inlet of intake duct, the loss measurements were performed at the conditions both with and without a grid. The flow pattern measurements, on the other hand, were made at the condition with a grid.
丂
丂
3. Numerical Technique
丂
A finite-volume based, commercial CFD software package STAR-CD was used for all computational results in this paper. The computational meshes are shown in Fig.4 for the two combinations. Since the computational domain includes 72,000 cells in each intake duct and 165,000 cells in the domain other than intake duct, the total mesh size is 309,000 cells. The turbulence model used here is a standard k-兠 model with wall function. A first-order upwind scheme is applied to get a stable solution at less CPU time. The flow velocity is specified at the inlet of computational domain and the exit section of each intake duct. At the exit of computational domain other than intake ducts, no flow condition is specified.