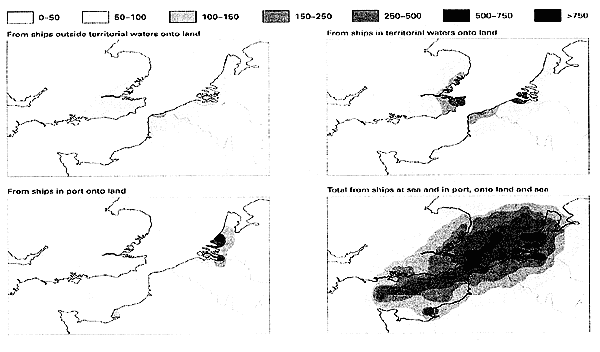
Fig.3: Contribution of ships to sulphur deposition (mg(S)/m2/year)
丂
Fig.4: Contribution of ships to sulphur deposition (mg(S)/m2/year)
丂
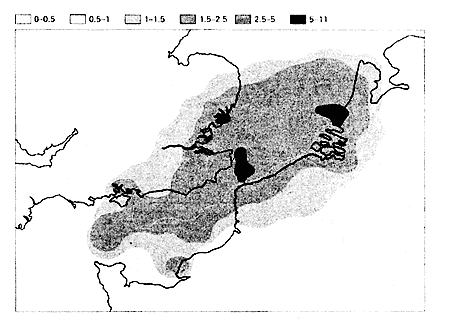
Fig.5: Contribution to Annual Mean SO2 Concentrations (兪g/m3)
丂
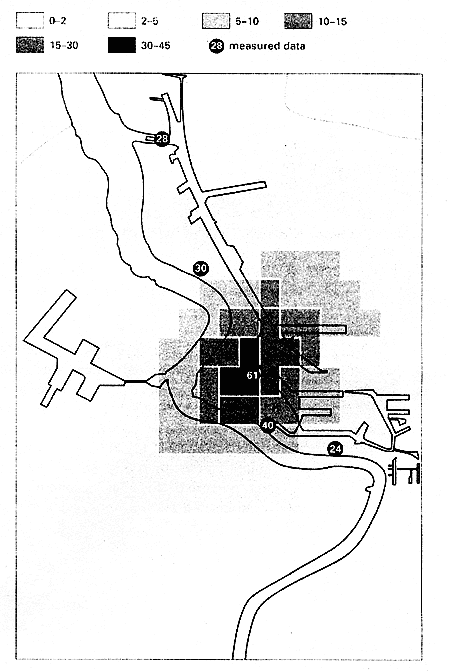
Fig.6: Predicted Contribution to Annual Mean SO2 from ships in the Port of Antwerp (兪g/m3)
丂
丂
丂
BACK丂丂丂CONTENTS丂丂丂NEXT
丂