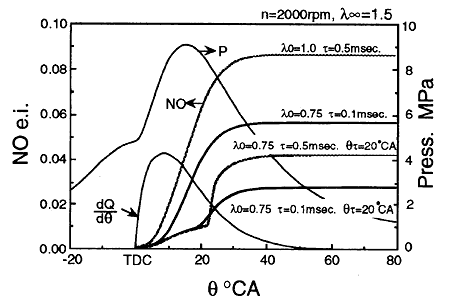
Fig.7 Effect of two-stage combustion calculated by NO reaction kinetics.
Figure 7 shows NO changes in the cylinder, where a number of successive cells are created and the heating value of the cells correspond to a given rate of heat release, as shown in the figure. The final excess air ratio (λ∞) after mixing with air is 1.5 for all the calculations. The curves show results with different initial excess air ratios before mixing (λ0), the mixing time (τ), and two stage combustion with mixing starting at 20 deg. ATDC. In the case of the two-stage combustion the mixtures are kept at the initial excess air ratio until 20 deg. ATDC, and then start mixing to be the final excess air ratio in r second. The emission index is defined relative to the total amount of injected fuel.
The figure shows that the amount of NO decreases by decreasing the initial excess air ratio from 1.0 to 0.75 and decreasing mixing time. It also shows that when the mixture is fuel-rich until 20 deg. ATDC, the NO emissions decrease significantly. With the same initial excess air ratio, shorter mixing times result in lower NO emissions. To reduce NO, the mixture should be fuel-rich until late in the expansion stroke and mixing should be completed in a short time.
This allows the conclusion that the key factors to maximize the effect of two-stage combustion are to maintain a fuel-rich mixture until the late expansion stroke and to reduce the time for mixing with air. This would result in the maximum possible reduction in both NO and smoke emissions.
Next, in order to find the relationships among the CCD jet parameters, mixing intensity and smoke reduction, analysis was made for the available experimental data. Smoke reduction index was defined as the ratio of smoke emission with the CCD jet versus the value without the CCD jet. It may be correlated to the characteristic tune of soot oxidation, τr, and the time available for reaction, τθ, which is a period in crank angle degrees for a variety of engine speeds:

where the suffixes j denotes the case with CCD injection, and 0 denotes base data without CCD injection. The characteristic time of soot oxidation in ordinary combustion without CCD injection appears to be proportional to the inverse of the carbon particle oxidation speed, ω, relative to the particle diameter, ds, as:

where the surface oxidation speed, ω, was set to 0.01 cm/sec and the soot particle diameter 10 nm from Ref.[17] When a CCD jet is injected, the characteristic time of soot oxidation is assumed to be proportional to the characteristic time of mixing by the jet. If the momentum of the mass injected in an unit time is denoted Mν (kg ・ m/s2), a dimensional analysis shows that the average characteristic time of mixing is correlated with the integrated momentum over the effective crank angle period, characteristic length, D (bore was used), and the total mass of fluid in the cylinder, mg, as:

where Ψ(θ) is a weighting factor expressing the effectiveness of the jet mixing depending on the crank angle: θa is the beginning of the effective period in crank angle, and θb the end of the effective period. In the present analysis the weighting factor Ψ(θ) was defined using Wiebe's function [18], because it must have a peak during the effective period, as follows:

The parameter m denotes the shape of the curve and the peak comes at the center of the period for m = 2, at earlier crank angles for <2, and at later positions for >2. The integral of Ψ becomes unity. Then substituting the above equations into Eq. (1), the smoke reduction index becomes:

where n is engine revolutions in rpm. The Mx* parameter indicates the effective mixing strength, and is defined as a mixing parameter here.
The CCD jet momentum was estimated from the analysis of indicator diagrams in the main combustion chamber and in the CCD. For the data with no pressure measurement in the CCD, a model to estimate heat release in the CCD were developed. With the model, the heat release rate was calculated from the availability of fuel and air in the CCD in each crank angle by assuming uniform gas compositions in the chamber. Until the start of the CCD fuel injection, it was assumed that the gas flows into the next chamber to create the same pressure in the two chambers, because the pressure difference in a precombustion chamber engine is generally small except for the initial strong combustion period. The heat release model was adjusted to fit with the data with available pressure information.
Figure 8 shows the relationship between the smoke reduction index and the mixing parameter for the data with different CCD orifice diameters. It shows that all the data arrange on curves, indicating a good correlation between the two parameters. The curves are different depending on the overall excess air factors,λ. With increases in the mixing parameter, Mx*, the smoke decreases more significantly for larger excess air factors. The datum, at the condition of λ = 3.6 and dφ = 2 mm, locates far above from the corresponding curve. This appears to be due to large smoke formation in CCD, because the smoke reduction index is greater than unity.
Figure 9 is the results for different CCD injection timings and different CCD chamber volumes. The curve in the figure is the one for λ = -1.5 in Fig.8. This also shows a good correlation between the smoke reduction index and the mixing parameter. As the CCD injection timing retards, the mixing parameter increases until 10°CA and then decreases with the timing retards more than 10°CA. The smoke reduction changes correspondingly with the changes in the mixing parameters. With the CCD volume 8.5% of the clearance volume, the mixing parameter becomes the largest and the smoke decreases most.
BACK CONTENTS NEXT