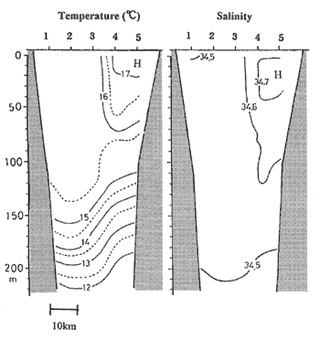
Fig. 6 Temperature (left) and salinity (right) sections between Stns.1 and 5.
3.5. Sea level changes in and around Sagami Bay
A sea level change in Sagami Bay is expected in relation to the temperature and current changes by the warm water intrusion. Fig.7 shows the adjusted sea levels at the coast in the bay. The zero line of sea level at each station is taken as the mean value during 15 d from January 1 to 15. The sea level rises started at Miyakejima (MK in Fig.1) and Kouzushima (KZ) on January 2 or 3, and were maximum on January 6. The increase of the sea level at both islands was 20-35 cm during only 4 d. The sea level rise at these islands indicates the Kuroshio to be close to Sagami Bay (e. g. , Kawabe, 1985). The sea level difference across the Kuroshio is 80-100 cm. Then, such a steep rise at Kouzushima suggests its rapid approach to Sagami Bay from January 2 to 6. After the maximum at both islands on January 6, the sea level fell at Kouzushima, but at Miyakejima it was preserved with small fluctuations.
The sea level in Sagami Bay was minimum in the early morning on January 5, but it rose about 10 cm at all stations from January 5 to 6, i. e. , only one day. After this phenomenon, a gentle rise continued until January 9 or 10. When the Kyucho occurred on January 9, the sea level rise was only 2-3 cm at the Sagami Bay coast. The significant sea level rise led the current and temperature changes in the bay by 3 or 4 d.