Fig. 11 Relation between NOx and engine speed n after the compensation of the dispersion of pmax/pc
丂
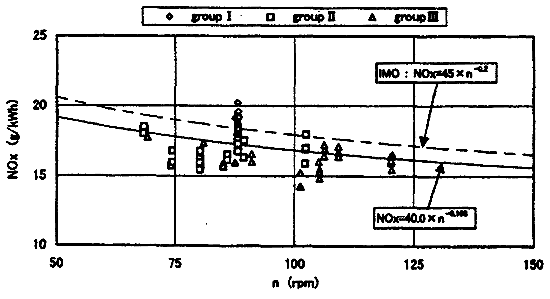
The approximation curve of NOx data as the exponential function of n was calculated by the least square fit method and the obtained equation is as bellow.
NOx = 40.0 亊 n-0.188丂丂丂(6)
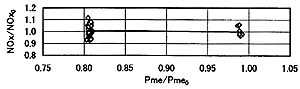
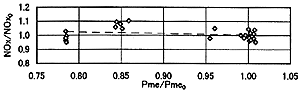
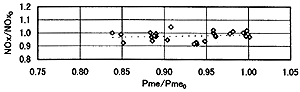
As seen from this figure, the approximation curve is almost parallel with the IMO regulation curve. Next, the all NOx data after compensation of the dispersion of pmax/pc were translated to those at the point of n/n0=1.0 by means of the equation (6). Then, the all NOx data at n/n0=1.0 were plotted against pme/pme0 for each engine type of A to G, subsequently the NOx value at pme/pme0=1.0 (NOx0) in each engine type was estimated. Finally, the all NOx data were translated to the values of NOx/NOx0, and they were plotted against pme/pme0 in each group. The results are shown in Fig.12.
It is confirmed from this figure that the NOx values are kept almost constant in spite of the decrease of pme/pme0, same as the analyzed change of Tmax shown in the figure (e) in Fig. 6.
Fig. 12 Relation between NOx/NOx0 and pme/pme0
丂
5. Conclusion
丂
As the results of the investigations for the change of Tmax under condition of the derating in the layout diagram by means of the performance simulation analysis, and also of the analysis of many measured NOx data on the shop trials, the following facts are clarified.
(1) The calculation results of the air flow rate by the three calculation methods defined by IMO coincide relatively well with the measured data.
(2) The part load characteristics of NOx on the large bore diesel engines are as follows. The NOx values at 25%L are approx. 80% of that at 100%L, those at 50%L are 85-95% and those at 75%L are 100乣110%. In case of higher rating engines, the NOx values at NOR are higher than that at MCR, on the other hand, in case of lower rating engines , the NOx values at NOR are almost same as that at MCR.
(3) As the results of the comparison between the E3 mode NOx and NOx at 100%L, it is found that they coincide well each other within the deviation of 亇5%. Therefore the evaluation results in this paper by using the NOx at 100%L are considered to be applied to those by E3 mode NOx.
(4) As the results of the investigations for the sensitivity factors of the fundamental four performance parameters of pmax/pme, ps/pme, V1/VH and V2/VH to the Tmax, it is found that the values of pmax/pc, which are defined by the combination of these four parameters, correspond well those of Tmax. Since Tmax is considered to be closely related to the NOx, the relations between pmax/pc, and NOx were examined by many measured data. As the results, it is found they have good correlativity in each other.
(5) When pme/pme0 was reduced under the constant pmax condition in the layout diagram within the range of pme/pme0=1.0乣0.8, if the slope of ps/pme against pme/pme0 was set as approx. -0.11, then ps/pme was made to increase gradually along with the decrease of pme/pme0 by the adequate turbocharger matching, Tmax can be kept almost constant, consequently the values of NOx can be also kept almost constant. This fact was clarified by the simulation analysis for Tmax and also by the measured NOx data analysis.