Accordingly, it was assumed that the change of the max. cylinder temperature in the actual engines was caused mainly by the dispersion of pmax/pc in every engine rating, and then the values of T4/Ts defined by the following equation (5), which is derived from equation (1), were calculated by means of the measured data of pmax/pme, ps/pme and pmae/pc and of the other calculated variables.

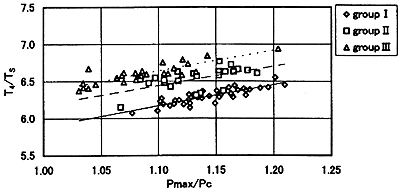
The calculated results of T4/Ts against pmax/pc are shown in the figure (a) in Fig. 9. Here Ts represents the scavenging temperature, and the values of k12=1.37, k24=1.31 and ηm=0.95 are adopted. It is seen from this figure that the data in each group with the different values of pme and etc. get together fairly well respectively, and the slope of T4/Ts against pmax/pc in every groups are almost same.
(a) Relation between Pmax/Pc and T4/Ts
(b) Relation between T4/Ts and NOx
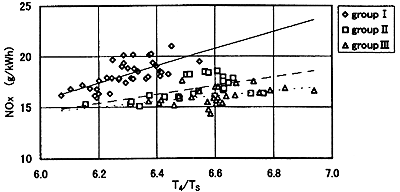
Fig. 9 Relation between pmax/pc and T4/Ts and that between T4/Ts and NOx
Also the measured values of NOx against T4/Ts are shown in the figure (b). There are found the well correspondence between NOx and T4/Ts in each group, although with the relatively large dispersion. Here the NOx values in each group are different each other against the same T4/Ts. The reason of it is considered due to the different configuration of the fuel injection nozzle in each group.
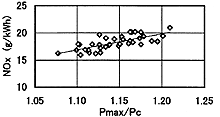
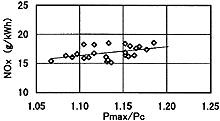
As mentioned above, since the main reason of the scattering of NOx is considered due to the change of Tmax cased*** by the dispersion of pmax/pc at shop trials, the relations between NOx values and pmax/pc in each group are examined. The results are shown in Fig. 10. As seen from this figure, the NOx values lie in the relatively well proportional relation with pmax/pc.
4.3 Relation between NOx and pme/pme0
Here, it was assumed that the normal values of pmax/pc against pme/pme0 in each group were given by the liner approximation curves obtained from the measured data shown in the figure (a) to (c) in Fig. 8. Then the compensation calculations of the NOx values regarding the dispersion of pmax/pc were executed by means of the slope of NOx against pmax/pc shown in Fig. 10. The compensated NOx values against engine speed n are shown in Fig. 11.
(a) group I
(b) group II
(c) group III
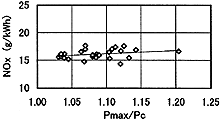
Fig. 10 Relations between pmax/pc and NOx in each engine group
BACK CONTENTS NEXT