3.1.3 HC
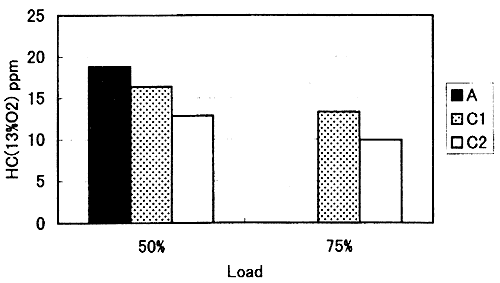
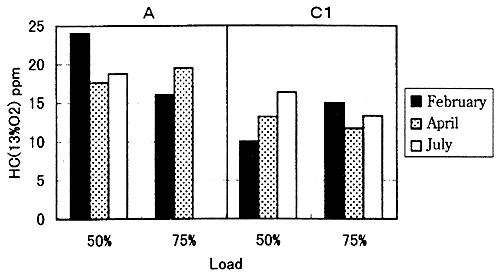
Fig. 9 shows the HC concentration for each fuel. Fig. 10 shows the change in the HC concentration to the measuring time in the fuel A and the fuel C1. It is understood from these results that the HC concentration is higher with MDF than with MFO. In the comparison of the fuel C1 with the fuel C2, the HC concentration was lower with the heavy fuel C2 which is higher in density and dynamic viscosity than with the fuel C1. The causes of generating HC are generally reported to include the incomplete combustion due to insufficiency in oxygen, temperature and residence time, but many points are still non-clarified in its generation mechanism. In a case of different fuel, it is considered that the production of HC depends on the composition thereof. MFO contains more cyclic hydrocarbon, and less chain hydrocarbon. It is thus believed that MFO produces more PM (Particulate Matter) than MDF4), but less HC. It is believed that the difference in fuel property was largely influenced in this test, and the HC concentration was lower with MFO than MDF.
No remarkable trend was found on the change in the N2O concentration to the measuring time.

Fig. 9 Effect of difference in fuel property on HC

Fig. 10 HC concentration to time of measurement
3.1.4 CO
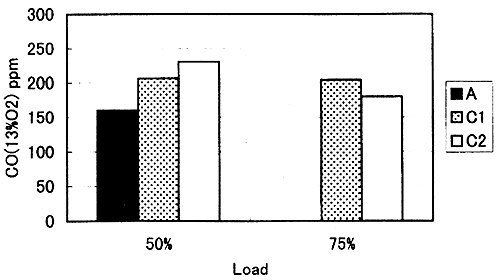
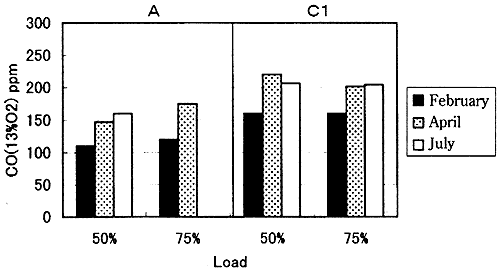
Fig. 11 shows the CO concentration for each fuel. Fig. 12 shows the change in the CO concentration to the measuring time with the fuel A and the fuel C1. It is shown from these results that the CO concentration is higher with MFO than with MDF. Though the CO concentration is closely related to the combustion condition, the fuel droplet is poorly atomized with MFO high in dynamic viscosity compared with MDF, and its combustion condition is also worse than MDF, and it is thus believed that the CO concentration was increased. No remarkable trend was found in the comparison of the fuel C1 with the fuel C2.
As for the trend of the change in the CO concentration to the measuring time, the CO concentration was lower in the order of February, April and July both with the fuel A and the fuel C1. The CO concentration is in the uniform relationship to the excess air ratio, and the excess air ratio was higher in the order of February, April and July from the measurement of the oxygen concentration in the exhaust gas, and it is thus considered that the CO concentration was lower in this order. The residual oxygen concentration in the exhaust gas was approximately 10.5%, 10.1% and 9% in 50% load, and 9.3%, 8.9% and 8.1% in 75% load, respectively in the order of February, April and July.

Fig. 11 Effect of difference in fuel property on CO

Fig. 12 CO concentraion to time of measurement
3.2 Effect of SCR system on the content of harmful exhaust emissions such as N2O
The diesel engine was run with 50% load and 75% load of the maximum continuous output with a propeller law using MDF (A) and two kinds of MFO (C1, C2) different in sulfur content and nitrogen content, and the effect of the SCR system on the exhaust gas concentration was examined by measuring the exhaust gas concentration for a case where no reducing agent was poured in the outlet of the SCR system and for a case where the reducing agent was poured.
BACK CONTENTS NEXT