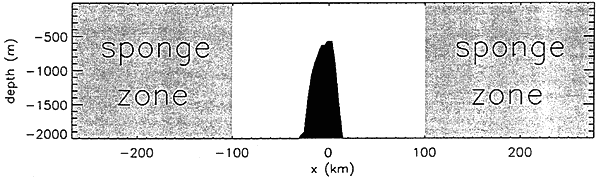
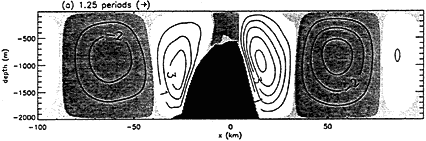
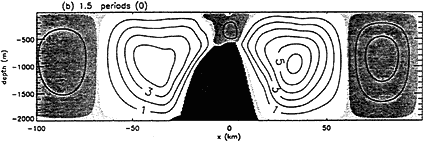
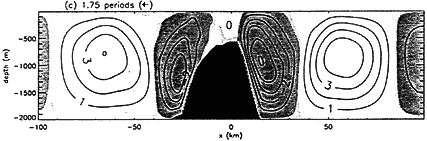
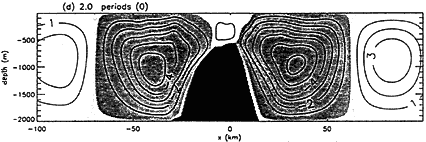
Fig. 2;丂The time series of the internal mode stream function in the M2 case during the second tidal period; after (a) 1.25, (b) 1.5, (c) 1.75, and (d) 2.0 periods. The contour interval is 1.0 亊 105cm2s-1. Values in non shaded areas and the thicker shaded areas are positive and negative, respectively, and the absolute values in the thinner shaded areas are less than 1亊104cm2s-1.