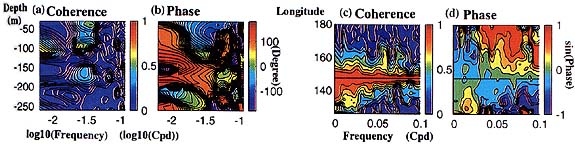
Plate 3丂(a) Vertical distribution of coherence between zonal wind stress at 147.375亱E and zonal current at 147亱E. Computation was made using data from November 1995 through October 1996. The horizontal axis is a logarithm of frequency in Cpd. (b) Same as (a) but phase. (c) Coherence between zonal wind speed at 147.375亱E and at longitude from 126亱E to 180亱E. (d) Same as (c) but Sine of phase (Tuus values vary from -1 to 1 instead of-180 to 180.).
丂
4-2丂Wind; regional coherence
Plate 1, Figure 2, Plate 2 and Plate 3 suggest the strong influence of 乬local乭 wind on near surface currents. However, it is possible that non-local wind forcing poses significant influences via equatorial trapped waves. For example, Kessler et al. (1995) showed that the depth variation of 20亷 isothem in the central Pacific was more correlated with wind forcing which occurred further west Although our observation sites are very close to the western boundary, it is still useful to know zonal coherence scale of zonal wind at the equator. Plate 3c and d show coherence and phase between zonal wind speed at 147.375亱E and those at longitude from 126亱E to 180亱E. These plates show that high coherence region has larger zonal scale atlower frequencies and it tends to extend more toward west than toward east. The region where conherence is higher than 0.5 extend from western boundary to 155-160亱E at the two frequency ranges where the coherence between zonal current and zonal wind was high and were discussed in the previously. These results suggest that it would be difficult to separate the effects of non-local forcing west of our observation sites from the effects of local forcing on our records.
丂
4-3丂Annual/semi-annual cycle of zonal current, stratification and wind
The annual and semi-annual variations were extracted by applying a three pole Butterworth filter with cutoff period at 150 days to the entire records. Before applying the filter, we have connected entire records from May 1994 to January 1998 so that we have more than half a year of records before and after the duration we describe in this paper. However, ECMWF wind data we have is up to the end of 1996 and, therefore, we need a caution to interpret low pass filtered wind of the latter half of 1996.
Figure 3 shows a time series of zonal wind stress at 147.375亱E (top panel), zonal currents at 40m, 60m, 80m and 100m (middle panel) at 147亱E and monthly mean 29亷 isotherm depth at 147亱E-0亱N and at 147亱E-2亱N丂(bottom panel). In the bottom panel, those records shorter than two weeks were omitted except those for July 1996 (13 days)
While the annual variation was dominant on zonal wind stress, zonal current shows relatively clear semi-annual variations; eastward (positive) peak in boreal summer and in boreal winter. Those peaks in boreal summer show time lag at depths. They occurred at 40m in May but in July at 80m. On the other hand, those peaks in boreal winter shows no noticeable time lag at depths. The bottom panel indicates that thermal mixed layer was fairly deep and steady from late 1995 through 1996. Plate 1, which shows that there was a westerly in May both in 1995 and 1996 although the one in 1996 was rather weak, and there was a eastward current near the surface at that time suggests that the positive peak occurred in May at 40m in Fig. 3 was caused by westerly at that time. Further study is necessary, however, to clarify why the same filter removed westerly event from wind record while it did not remove eastward current. Plate 1 also shows that EUC started branching off and forming upper core in June. This upper core disappeared in August. The positive peak at 100m an 80m, which occurred in July, were caused by this upper branch of EUC rather than the result of 乬diffusion乭 of momentum from the surface. One of the possible causes of the formation of this upper branch is the meridional pressure gradient caused by equatorial upwelling due to the Ekman divergence which in turn, was caused by seasonal easterly wind (trade) (Philander, 1973). The bottom panel of Fig. 3 shows that 29亷 isotherm at the equator shoaled in boreal summer of 1996.